
Figures & data
Table 1. Participant characteristics at baseline.
Figure 1. Flow chart for study participation.
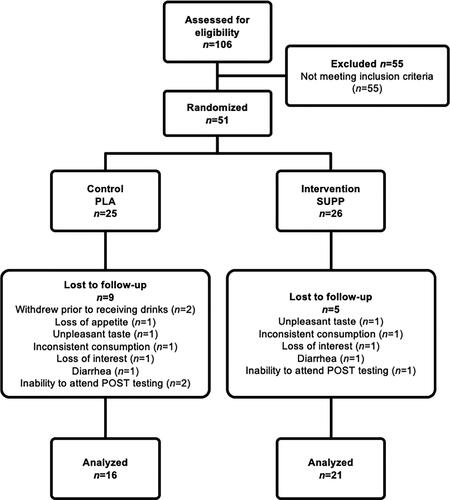
Figure 2. Changes in plasma concentrations of total (EPA + DHA) LC n-3 PUFA in response to the intervention. sssp < .001 for SUPP vs PRE.
EPA indicates eicosapentaenoic acid; DHA, docosahexaenoic acid; LC n-3 PUFA, long chain n-3 polyunsaturated fatty acids; SUPP, supplement; PRE, baseline.
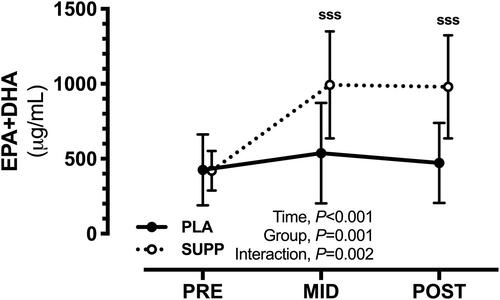
Figure 3. Changes in body composition assessed by (A) body mass, (B) lean body mass, and (C) fat mass in response to the intervention. ssp < .01 and sssp < .001 for SUPP vs PRE.
SUPP indicates supplement; PRE, baseline.
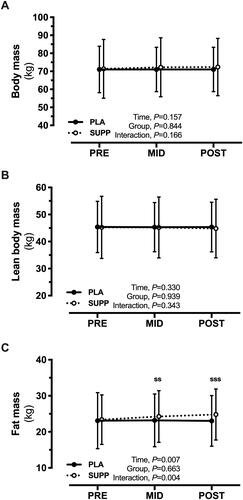
Figure 4. Changes in physical function assessed by (A) hand-grip strength, (B) gait speed, (C) chair rise test, and (D) balance. ssp < .01 and sssp < .001 for SUPP vs PRE. ppp < .01 PLA vs PRE.
SUPP indicates supplement; PRE, baseline; PLA, placebo.
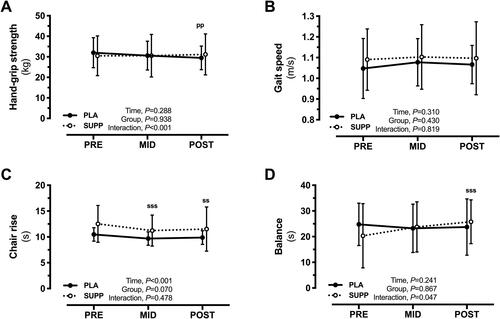
Table 2. Changes in serum concentrations of markers of metabolic health after 3 (MID) and 6 (POST) months of intervention.