
Figures & data
Figure 1. Study flow diagram.
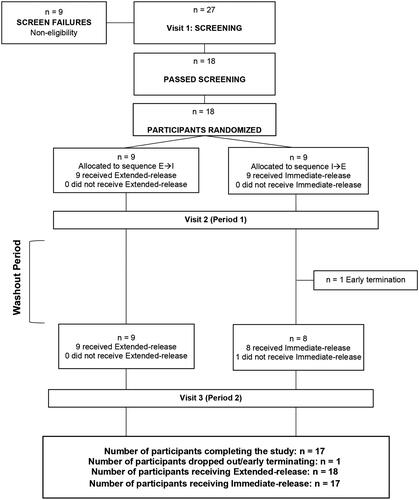
Table 1. Demographics and baseline characteristics.
Figure 2. Total plasma melatonin concentrations. Data are mean ± SD at pre-dose (0 h) and 0.25, 0.5, 0.75, 1, 2, 3, 4, 5, 6, 8, and 10 h post-dose for participants in the PP population (n = 17). PP: per protocol; SD: standard deviation.
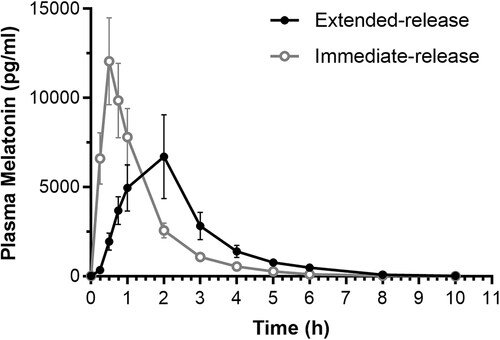
Table 2. Comparison of pharmacokinetic parameters of extended-release and immediate-release melatonin.