
Figures & data
Figure 1. (A) MALDI-TOF MS positive reflectron mode analysis of the PAC fraction from Ellura® cranberry juice extract (CJE) (A) and the PAC fraction from whole cranberry fresh fruit (B), preceded by Sephadex LH-20 clean up. The predominate oligomeric distribution (Δ 288 amu) (m/z = 887, 1175, 1463, 1751, 2039) is representative of PACs that contain at least one A-type interflavan bond at each degree of polymerization from trimer to heptamer. All PACs are detected as sodium ion adducts [M + Na]+.
![Figure 1. (A) MALDI-TOF MS positive reflectron mode analysis of the PAC fraction from Ellura® cranberry juice extract (CJE) (A) and the PAC fraction from whole cranberry fresh fruit (B), preceded by Sephadex LH-20 clean up. The predominate oligomeric distribution (Δ 288 amu) (m/z = 887, 1175, 1463, 1751, 2039) is representative of PACs that contain at least one A-type interflavan bond at each degree of polymerization from trimer to heptamer. All PACs are detected as sodium ion adducts [M + Na]+.](/cms/asset/3432858e-5c36-4345-9975-911303976e67/ijds_a_2356592_f0001_b.jpg)
Table 1. Deconvolution of positive reflectron mode MALDI-TOF MS showing cranberry fruit PAC and CJE PAC samples containing PAC oligomeric distribution from trimers through hexamers, with predominantly one or more A-type bonds at each degree of polymerization.
Figure 2. Representative photomicrographic images of P-type and Type 1 E. coli in vitro anti-adhesion activity (AAA) results expressed as minimum inhibitory concentration (MIC) of D-mannose (DM), Ellura® cranberry juice extract (CJE) and PAC fraction isolated from CJE using hemagglutination-based assays. The dilution series from 60 mg/mL–0.03 mg/mL is presented along the top row and the MIC results for each test sample are displayed in each column. Yellow star indicates resulting MIC dilution required to suppress hemagglutination of bacteria by 50% in each test run. *Scale of relative AAA represents potential in vivo efficacy of samples. (See Bosley et al. Citation2024, for further explanation of the scale).
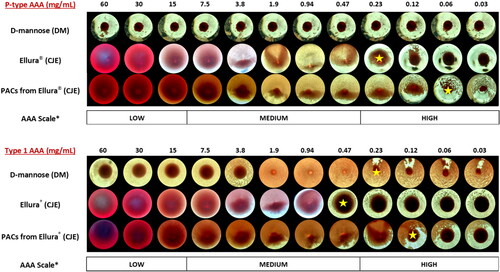
Table 2. P-type and Type 1 E. coli in vitro bacterial anti-adhesion activity (AAA) of investigational products and crude extract fractions from cranberry juice extract (CJE) product and whole cranberry fresh fruit.
Figure 3. Urinary Type 1 and P-type E. coli (ex vivo) anti-adhesion activity (AAA) of all participants at each urine collection time point at time 0 and after intake of either cranberry juice extract (CJE) (Ellura®) or D-mannose (DM) over each 1-week study period. AAA level 0 = no activity, 1 = 50% activity, 2 = 100% activity.
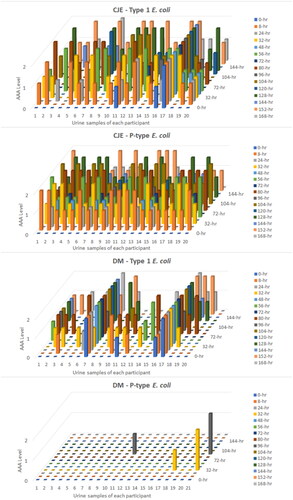
Figure 4. Cranberry juice extract (CJE) and D-mannose (DM) P-type and Type 1 E. coli average percent urinary AAA of all participants (ex vivo) at urine collections 8 h after each product intake time period. Urine collections of participants with positive AAA background samples at time 0 (4/20 for Type 1-DM and 3/20 for Type 1-CJE) were removed from the data analysis to allow AAA contributions of the DM or CJE products to be determined without being confounded by endogenous inhibitor with Type 1 AAA that was present in the background urines and likely present in the other urine collections taken by those participants.
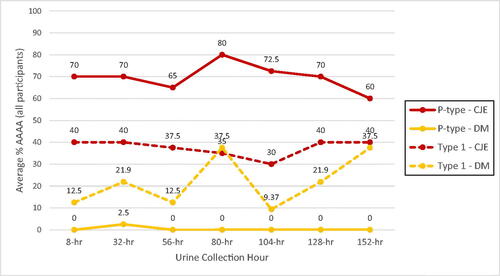
Figure 5. Cranberry juice extract (CJE) and D-mannose (DM) P-type and Type 1 E. coli average percent urinary AAA (ex vivo) of all participants at urine collections 24 h after each product intake time period. Urine collections of participants with positive AAA background samples at time 0 (4/20 for Type 1-DM and 3/20 for Type 1-CJE) were removed from the data analysis to allow AAA contributions of the DM or CJE products to be determined without being confounded by endogenous inhibitor with Type 1 AAA that was present in the background urines and likely present in the other urine collections taken by those participants.
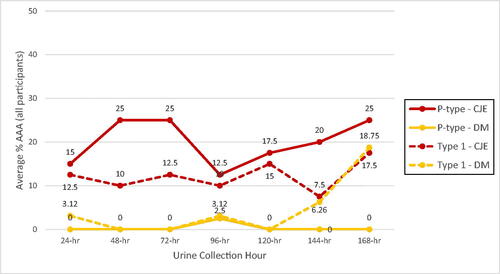
Table 3. P-type and Type 1 E. coli average precent ex vivo anti-adhesion activity (AAA) of urine at each 8-hr and 24-hr urine collection from all participants after each 24-hr intake of CJE and DM investigational products over each 1-week study period, and the total average percent AAA over all time periods and participants combined, and the overall percentage of participants that did not respond to the products in any urine-collection time period.
Table 4. Highest median AAA scoreTable Footnote1 reached in participant urine at each urine collection time point following intake of CJETable Footnote2 and DMTable Footnote3 over the 1-week period. Summary of statistical results analyzed using the bootstrap method with a randomization 1-sample randomization t-test and the nonparametric Wilcoxon test.
Table 5. Total number of times an AAA score of 2Table Footnote1 was achieved following intake of CJETable Footnote2 and DMTable Footnote3 in each 1-week treatment period for each participant. Summary of statistical results analyzed using the bootstrap method with a randomization 1-sample randomization t-test and the nonparametric Wilcoxon test.
Supplemental Material
Download MS Word (414.7 KB)Data availability statement
Data described in the manuscript will be made available upon request pending approval.