
Figures & data
Figure 1. Effect of prebiotic, probiotic, synbiotic low dose, and synbiotic high dose on base-acid consumption in the proximal Colon (PC) (left) and distal Colon (DC) (right).
The average weekly base-acid consumption (mL/day) during the control period (CTRL; n = 4), the first week of the treatment period (TR1; n = 4), and the final week of the treatment period (TR3; n = 4) are shown. *represents p < 0.05 relative to the preceding period for each test product. # represents p < 0.05 between CTRL and TR3 for each test product. p < 0.05 between different test products are indicated with different letters; lower case letters are used for TR1 and capital letters are used for TR3.
CTRL, control period; DC, distal colon; PC, proximal colon; TR1, treatment week 1; TR3, treatment week 3.
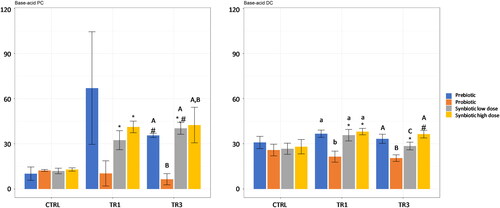
Figure 2. Gas production (kPa) following blank or prebiotic, probiotic, synbiotic low dose, and synbiotic high dose supplementation across different time intervals over 48 h (short-term colonic incubations).
Short-term colonic incubations were inoculated with proximal colon (PC) microbiota derived from the M-SHIME® reactors collected at the end of the control period (CTRL; representing the non-adapted microbial community) or at the end of the treatment period (TR3; representing the pre-adapted microbial community) for each test condition (n = 4). *represents p < 0.05 relative to corresponding blank for each test product. p < 0.05 between different test products (normalized to their own blank incubation) are indicated with different letters; lower case letters are used for the pre-adapted microbial community and capital letters are used for the non-adapted microbial community.
CTRL, control period; PC, proximal colon; TR3, treatment week 3.
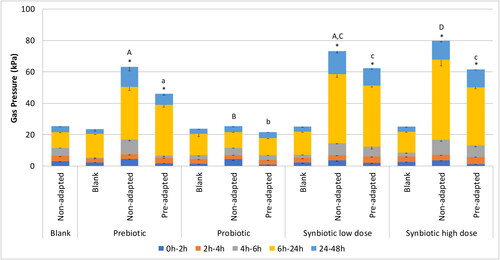
Figure 3. Effect of prebiotic, probiotic, synbiotic low dose, and synbiotic high dose on short-chain fatty acid (SCFA) and lactate production in the proximal Colon (PC) (left) and distal Colon (DC) (right).
The average weekly (3A) acetate (mM), (3B) propionate (mM), (3C) butyrate (mM), or (3D) lactate (mM) production during the control period (CTRL; n = 4), the first week of the treatment period (TR1; n = 4), and the final week of the treatment period (TR3; n = 4) are shown. * represents p < 0.05 relative to the preceding period for each test product. #represents p < 0.05 between CTRL and TR3 for each test product. p < 0.05 between different test products are indicated with different letters; lower case letters are used for TR1 and capital letters are used for TR3.
CTRL, control period; DC, distal colon; PC, proximal colon; SCFA, short-chain fatty acid; TR1, treatment week 1; TR3, treatment week 3.
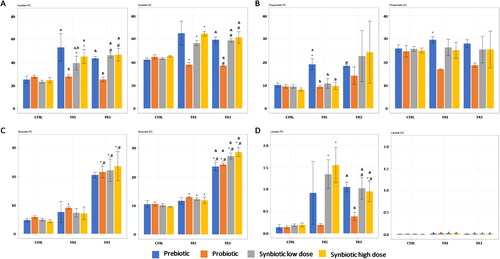
Figure 4. Effect of prebiotic, probiotic, synbiotic low dose, and synbiotic high dose on ammonium and branched short-chain fatty acid (bSCFA) production in the proximal Colon (PC) (left) and distal Colon (DC) (right).
The average weekly (4A) ammonium (mg/L) and (4B) bSCFA (mM) production during the control period (CTRL; n = 4), the first week of the treatment period (TR1; n = 4), and the final week of the treatment period (TR3; n = 4) are shown. *represents p < 0.05 relative to the preceding period for each test product. # represents p < 0.05 between CTRL and TR3 for each test product. p < 0.05 between different test products are indicated with different letters; lower case letters are used for TR1 and capital letters are used for TR3.
bSCFA, branched short-chain fatty acid; CTRL, control period; DC, distal colon; PC, proximal colon; TR1, treatment week 1; TR3, treatment week 3.
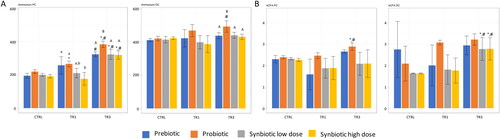
Figure 5. Discriminant Analysis Of Principal component (DAPC) plots representing absolute abundance in the luminal proximal Colon (PC), luminal distal Colon (DC), mucosal PC, and mucosal DC.
Data are shown for prebiotic, probiotic, synbiotic high dose, and synbiotic low dose during the control period (CTRL; n = 4), the first week of the treatment period (TR1; n = 4), and the final week of the treatment period (TR3; n = 4) of the M-SHIME® study.
CTRL, control period; DAPC, Discriminant Analysis of Principal Component; DC, distal colon; PC, proximal colon; TR1, treatment week 1; TR3, treatment week 3.
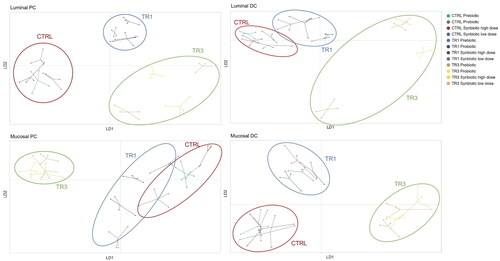
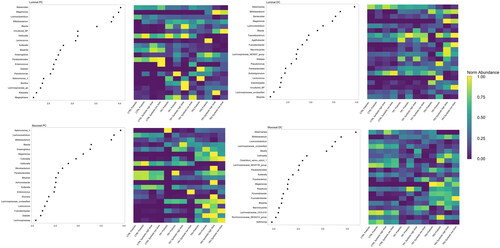
Figure 6. Overall treatment linear Discriminant effect size (LEfSe) analysis and average Operational Taxonomic unit abundance by treatment in the luminal proximal Colon (PC), luminal distal Colon (DC), mucosal PC, and mucosal DC.
LEfSe analysis was conducted on the Total-Sum Scaled taxonomic abundances at the genus level following supplementation with prebiotic, probiotic, synbiotic high dose, and synbiotic low dose. The heatmap shows the intra-taxon normalized abundances of the taxa with the highest LDA scores at each timepoint, including the control period (CTRL; n = 4), the first week of the treatment period (TR1; n = 4), and the final week of the treatment period (TR3; n = 4).
CTRL, control period; DC, distal colon; LEfSe, Linear Discriminant Effect Size; PC, proximal colon; TR1, treatment week 1; TR3, treatment week 3.
P1564_Supplemental Materials_Final.docx
Download MS Word (2.1 MB)Data availability statement
The data supporting the findings of this study are available from the corresponding author on reasonable request.