Figures & data
Figure 1. Detection of phagocytic activity in day 5 blastocyst under transmission electron microscope. (A) No evidence of phagocytic activity is observed in the cytoplasm of trophectoderm. (B) One microsphere is found within trophectoderm cell. Short arrow shows the phagocytosed microsphere. M: mitochondria. Bars: (A) 2 μm; (B) 2 μm; 49 x 17 mm (300 x 300 DPI).
Figure 2. Phagocytosis by trophectoderm in day 6 blastocyst under transmission electron microscope. (A) Many microspheres are observed within trophectoderm cells after overnight co-culture. Short arrow shows the profile of microspheres. (B) Distorted trophectoderm cell with intracellular microsphere. (C) Phagocytic cup formation. Long arrow points to the membrane protrusions and short arrow indicates a phagocytosed microsphere. (D) Phagocytosis of cell debris. Long arrow shows the membrane protrusions and short arrow indicates cell debris. M: mitochondria. Bars: (A) 2 μm; (B) 0.5 μm; (C) 0.5 μm; (D) 1 μm; 83 x 49 mm (300 x 300 DPI).
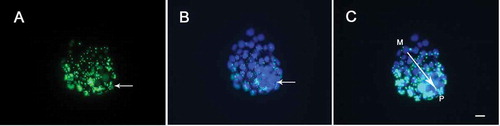
Figure 3. Phagocytic analysis of microspheres by day 6 blastocyst under fluorescence microscopy. (A) Granulated green fluorescence emitted by phagocytosed microspheres. Long arrow shows inner cell mass (ICM) region, where green fluorescence intensity is higher. (B) TE and ICM nuclei staining with DAPI. Long arrow shows ICM location, where blue nuclei are densely packed. (C) Merged images of A and B. The polar-mural axis is indicated by the single-headed arrow. P: polar; M: mural; Bar = 20 μm; 140 x 34 mm (300 x 300 DPI).