Figures & data
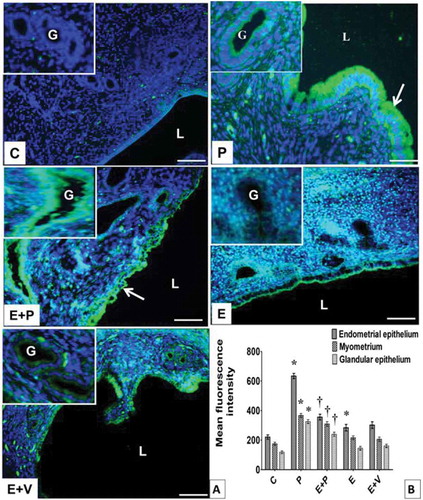
Figure 6. Distribution and expression levels of CAXII in uterus. (A) CAXII was distributed in different uterine compartments. Arrows pointing towards CAXII in endometrial epithelium. (B) Levels of CAXII protein in different uterine compartments. The highest fluorescence intensity for CAXII was observed in epithelia and myometrium of progesterone-treated rats. All data were expressed as mean ± SEM for four independent observations. *p<0.05 compared to C, †p<0.05 compared to E+V. E: estrogen, P: progesterone, C:control, V: vehicle (control). L: lumen, G: glands, Scale bar = 100μM.