Figures & data
Figure 1. Model reconstruction procedure and findings. We first collected the sperm-specific proteomic data from databases and literature. Then, after converting the protein data to the corresponding gene data, we used them for reconstructing the sperm-specific metabolic network model. Finally, we used the reconstructed model for analyzing energy metabolism in healthy sperm and in asthenozoospermia. After that, under single knockout analysis, our model predicted several genes that may play a role in asthenozoospermia.
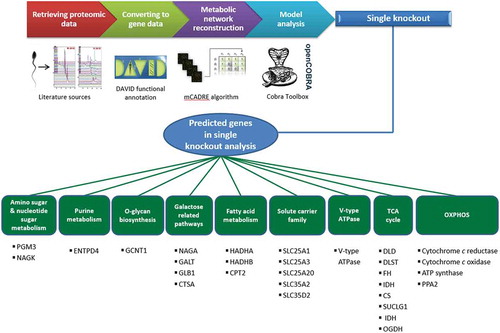
Figure 2. From the total of 29 predicted essential gene sets, 18 gene sets (62%) were previously reported in the literature to be linked to ATP production, and thus, to asthenozoospermia. To the best of our knowledge, the other 11 gene sets (38%) have not previously reported to be linked to asthenozoospermia. The accompanying table shows a list of these genes.
Figure 3. The four reaction categories which show flux decrease or increase in the knockout model based on FVA [Hadi and Marashi Citation2014]. X-axis represents total reactions possible flux ranges. The solid color lines represent the flux of reaction in normal sperm cell model, (ranges from c to d). The dashed arrows indicate the flux of reaction in knockout model (ranges from a to b). If this means a high confidence decrease, however if
it means a high confidence increase. If
, it will result in a decrease, while if
it will result in an increase.
![Figure 3. The four reaction categories which show flux decrease or increase in the knockout model based on FVA [Hadi and Marashi Citation2014]. X-axis represents total reactions possible flux ranges. The solid color lines represent the flux of reaction in normal sperm cell model, (ranges from c to d). The dashed arrows indicate the flux of reaction in knockout model (ranges from a to b). If this means a high confidence decrease, however if it means a high confidence increase. If , it will result in a decrease, while if it will result in an increase.](/cms/asset/b0178c11-7afc-468c-a162-22aff1aec437/iaan_a_1263367_f0003_oc.jpg)
Table 1. Novel genes predicted by the SpermNet model to play a role in asthenozoospermia.
Table 2. List of genes that are known to be linked to asthenozoospermia but have not been predicted to influence ATP production by the SpermNet model.
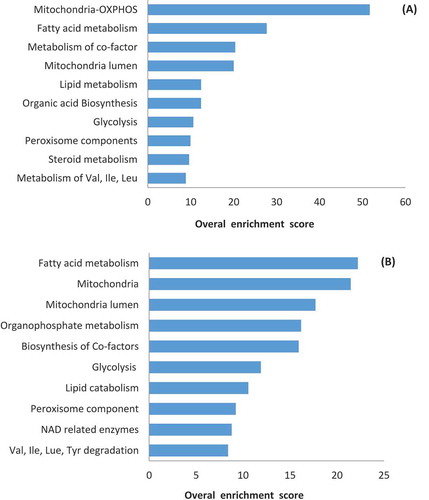
Figure 4. Enriched pathways based on inactivated or activated genes in gene knockout simulations. (A) Enriched pathways based on 307 inactivated genes as a result of deleting asthenozoospermia-implicated metabolic genes not predicted by SpermNet. (B) Enriched pathways based on 287 activated genes as a result of deleting asthenozoospermia-implicated metabolic genes not predicted by SpermNet.