Figures & data
Table 1. Characteristics and quality assessment of the studies included in the meta-analysis.
Figure 1. Flow diagram of literature search. 217 indexes were retrieved from all databases (the Cochrane Library, PubMed, Embase, ISI–SCI, CBMdisc). 16 were left after articles screened on basis of title and abstract. A total of seven randomized controlled trials (RCTs) comprising 1,781 patients were included in the analysis. Main reasons of exlusion were: trials were not comparison of three surgical approaches, not RCTs or did not have similar endpoints.
Figure 2. Pooled results of pregnancy rates after microsurgical, laparoscopic, and open varicocelectomies. Pregnancy rate of microsurgical varicocelectomy was higher than that of the open group (RR = 1.37, 95% CI: 1.12-1.69, p = 0.002), while nonsignificant difference was found between the microsurgical group and the laparoscopic group (RR = 1.14, 95% CI: 0.91-1.42, p = 0 25) or between the laparoscopic group and the open group (RR = 1.09, 95% CI:. 0.76-1.56, p = 0.66).
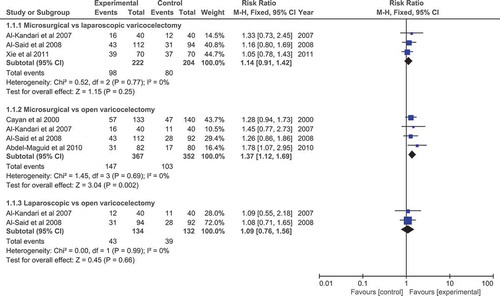
Figure 3. Pooled results of sperm concentration (million mL−1) after microsurgical, laparoscopic and open varicocelectomies. The microsurgical and laparoscopic groups both had more increases in postoperative sperm concentration than the open group (mean difference, MD = 5.59, 95% CI: 1.46-9.72, p = 0.008 and MD = 5.10, 95% CI: 1.29-5.13, p = 0.001, respectively). There was nonsignificant difference between the microsurgical and laparoscopic groups (MD = 3.21, 95% CI): -0.78 to 10.98, p = 0.09).
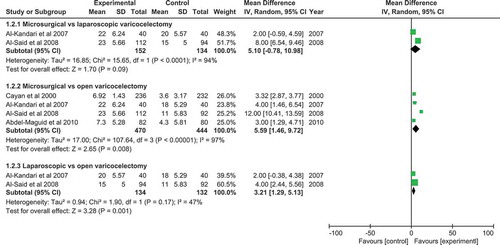
Figure 4. Pooled results of sperm motility (%) after microsurgical, laparoscopic, and open varicocelectomies. Microsurgical group had better improvement in postoperative sperm motility than the open group (MD = 5.56, 95% CI: 0.77-10.36, p = 0.02), and nonsignificant difference was found between the microsurgical group and laparoscopic group (MD = 2.09, 95% CI: -3.78 to 7.97, p = 0.49) and between the laparoscopic group and open group (MD = 1.89, 95% CI: -2.02 to 5.81, p = 0.34).
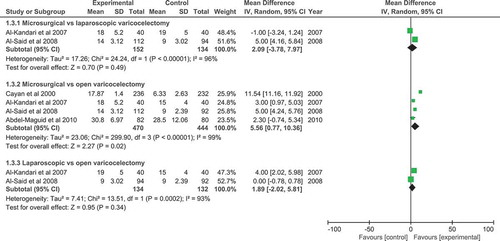
Figure 5. Pooled results of operative time (minutes) after microsurgical, laparoscopic, and open varicocelectomies. The duration of microsurgical varicocelectomy was longer than that of laparoscopic and open varicocelectomy (MD = 23.47, 95% CI: 4.81-42.13, p = 0.01 and MD = 25.18, 95% CI: 11.13-39.22, p = 0.0004, respectively). The difference between the laparoscopic group and open group was not statistically significant (MD = -0.62, 95% CI: -15.56 to 14.33, p = 0.94).
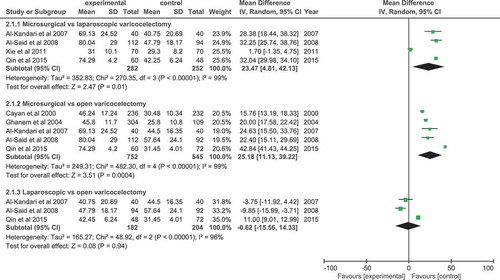
Figure 6. Pooled results of hospital stay (days) after microsurgical, laparoscopic, and open varicocelectomies. There was nonsignificant difference between the three groups (microsurgical vs. laparoscopic: MD = -0.41, 95% CI: -0.94 to 0.12,; = 0.13, microsurgical vs. open: MD = -1.01, 95% CI: -2.79 to 0.76, p = 0.26, and laparoscopic vs. open: MD = -0.63, 95% CI: -1.44 to 0.19, p = 0.13).
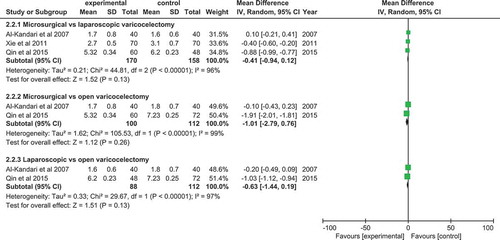
Figure 7. Pooled results of time to return to work (days) after microsurgical, laparoscopic, and open varicocelectomies. The time to return to work of both microsurgical group and laparoscopic group was significantly shorter than that of the open group (MD = -1.96, 95% CI: -2.08 to -1.84, p <0.00001 and MD = -0.97, 95% CI: -1.60 to -0.34, p = 0.002 respectively). While the average time to return to work of the microsurgical group was shorter than that of the laparoscopic group, there was no statistical difference (MD = -0.21, 95% CI: -0.88 to 0.45, p = 0.53).
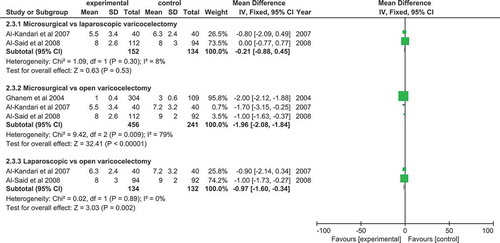
Figure 8. Comparison of incidence of postoperative complications between the three groups. The microsurgical varicocelectomy had significantly lower incidence of postoperative complications than the laparoscopic group and open group (OR = 0.22, 95% CI: 0.11-0.46, p <0.0001 and OR = 0.21, 95% CI: 0.12-0.37, p <0.00001, respectively). Between the laparoscopic group and open group, nonsignificant difference was found (OR = 1.17, 95% CI: 0.68-2.03, p = 0.57).
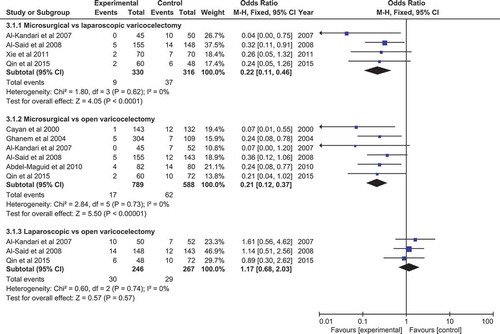
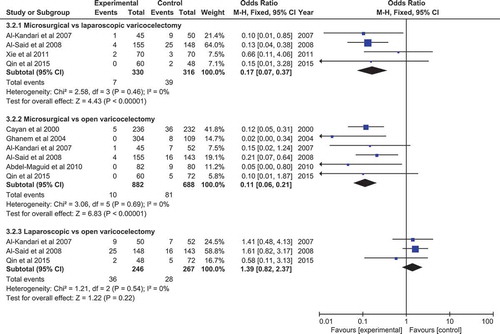
Figure 9. Comparison of recurrence rate between the three groups. Recurrence rate of microsurgical group was significantly lower than that of the laparoscopic group and open group (OR = 0.17, 95% CI: 0.07-0.37, p <0.00001 and OR = 0.11, 95% CI: 0.06-0.21, p <0.00001, respectively). There was no statistical difference between the laparoscopic group and open group (OR = 1.39, 95% CI: 0.82-2.37, p = 0.22).