Figures & data
Table 1. Basic characteristics of the two groups.
Table 2. Cycle outcome variables of the two groups.
Figure 1. Distribution of day 3 embryo grades. Day 3 embryos were assessed and divided into four different grades according to the ASEBIR embryo assessment criteria [Alpha Scientists in Reproductive Medicine and ESHRE Special Interest Group of Embryology, et al. Citation2011]. Grade 1 and grade 2 embryos were considered as high quality embryos, grade 1, grade 2, and grade 3 embryos were considered as available embryos, while grade 4 embryos were usually deserted. (A) shows that grade 1 and grade 2 embryo rates decreased while grade 3 and grade 4 embryo rates increased as a function of total day 3 embryos in the degeneration group (p = 0.035). (B) shows there was no significant difference in the distribution transferred embryo grades on day 3 between the two groups (p = 0.537).
![Figure 1. Distribution of day 3 embryo grades. Day 3 embryos were assessed and divided into four different grades according to the ASEBIR embryo assessment criteria [Alpha Scientists in Reproductive Medicine and ESHRE Special Interest Group of Embryology, et al. Citation2011]. Grade 1 and grade 2 embryos were considered as high quality embryos, grade 1, grade 2, and grade 3 embryos were considered as available embryos, while grade 4 embryos were usually deserted. (A) shows that grade 1 and grade 2 embryo rates decreased while grade 3 and grade 4 embryo rates increased as a function of total day 3 embryos in the degeneration group (p = 0.035). (B) shows there was no significant difference in the distribution transferred embryo grades on day 3 between the two groups (p = 0.537).](/cms/asset/86da7ffd-c08c-4d5c-938d-253332d78ff7/iaan_a_1272648_f0001_oc.jpg)
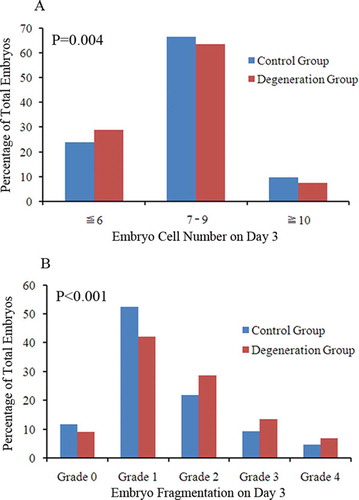
Figure 2. Embryo morphology analysis on day 3. The number of day 3 embryo cells were divided into ‘slow’ embryos with ≤ 6 cells, ‘normal’ embryos with 7-9 cells, and ‘accelerated’ embryos with ≥ 10 cells. Embryo fragmentation grades were divided into five grades: Grade 0 embryos were those with no fragmentation, grade 1 embryos were those with < 10% fragmentation, grade 2 embryos were those with 11%-25% fragmentation, grade 3 embryos were those with 26%-50% fragmentation, and grade 4 embryos were those with > 50% fragmentation. (A) Shows the degeneration group got lower proportions of ‘normal’ embryos and ‘accelerated’ embryo, higher proportion of ‘slow’ embryos compared to the control group (p = 0.004). (B) shows that grade 0 and grade 1 fragmentation rates decreased while grade 2, grade 3, and grade 4 fragmentation rates increased in the degeneration group (p < 0.001).