Figures & data
Table 1. Characteristics of the women undergoing endometrial biopsy sampling.
Table 2. Top 20 dysregulated lncRNA transcripts in RIF endometrium.
Figure 1. Clustering analysis results. Each line represents one long noncoding RNA (lncRNA) and each column represents one endometrial sample. The relative lncRNA expression is depicted according to the color scale. Red column indicates up regulation and green column indicates down regulation. Recurrent implantation failure (RIF) 1~7 represent RIF endometrial samples and Control 1~5 represent receptive control endometrial samples.
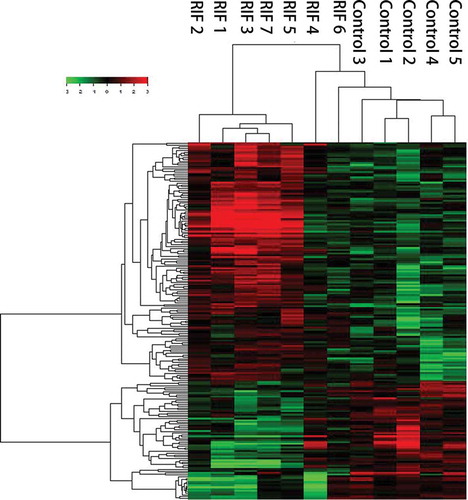
Figure 2. RT-qPCR validation of the eight selected lncRNAs transcripts. The grey columns represent results of microarray study, the dark (red) columns represent results of RT-qPCR validation. The heights of the columns represent the fold changes. Fold change is positive when the lncRNA is up regulated (RIF/Control) and negative when down regulated. The whole name of the selected lncRNA transcripts were replaced with probe number. lncRNA: long noncoding RNA; RIF: recurrent implantation failure.
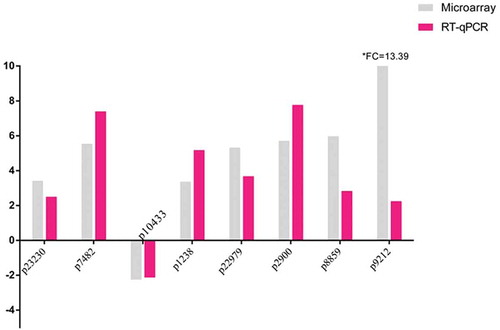
Figure 3. LncRNA-mRNA co-expression network. The yellow circles represent lncRNAs and the green rings represent mRNAs. Red connection lines indicate that the lncRNAs positively co-express with the connected mRNA transcripts, and the blue lines mean the contrast. The diameter of each yellow circle implies degree centrality. lncRNA: long noncoding RNA.
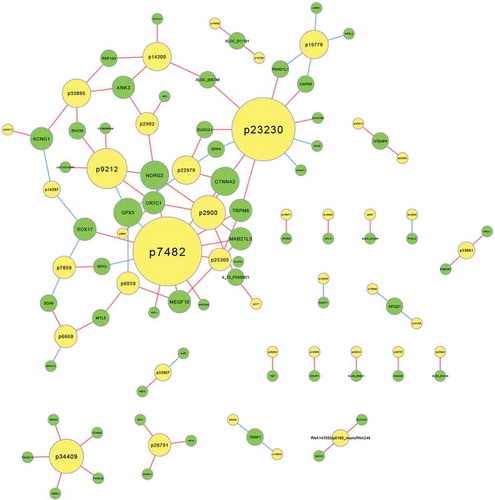
Figure 4. GO enrichment analysis and KEGG pathway annotations of targets of co-expressed mRNAs. (A) Biological processes; (B) cellular components; (C) molecular functions; (D) KEGG pathway annotation. The horizontal ordinate shows the enrichment score. The ordinate shows the list of top ten biological processes, cellular components, molecular functions, and KEGG pathways. GO: Gene Oncology; KEGG: Kyoto Encyclopedia of Genes and Genomes.
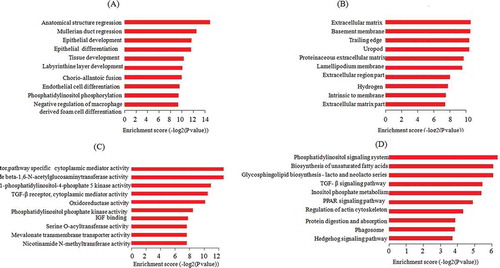
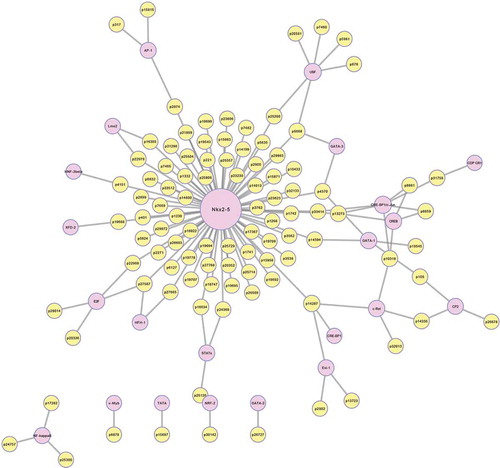
Figure 5. LncRNA-TF core network. LncRNA-TF core network consisting of 170 lncRNA-TF pairs with the highest matrix match score. The purple circles represent TFs and yellow circles represent lncRNAs. lncRNAs: long noncoding RNAs; TF: transcription factor.