Figures & data
Figure 1. Cell viability and global H3K4me2 level of GFFs treated with different concentrations of 2-PCPA. (A) Cell viability of GFFs treated with different concentrations of 2-PCPA. Cell viability was indicated as the ratio of 2-PCPA treated groups relative to untreated ones. (B) Staining of H3K4me2 (green) and DNA (blue) in GFFs. (C) Relative fluorescence intensity compared with control group (0 μM) was calculated. The ratio of H3K4me2 to DAPI when GFFs were treated with 2-PCPA (0 μM) was set as 1.0. Data are presented as the mean ± SD of three independent experiments. Different superscripts represent significant difference between treated group and control group (p < 0.05). H3K4me2: H3K4 dimethylation; GFFs: goat fetal fibroblast cells; 2-PCPA: trans-2-Phenylcyclopropylamine. Scale bar = 50 μm.
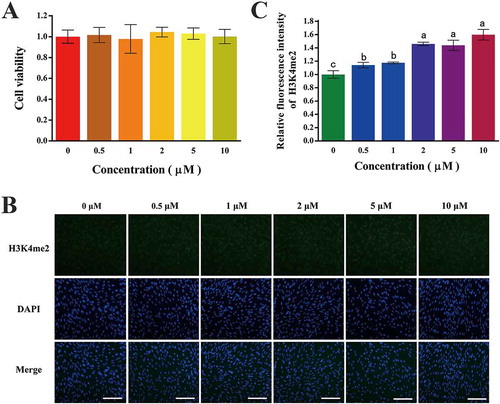
Figure 2. Cell cycle and expression of pluripotency genes of GFFs treated with different concentrations of 2-PCPA. (A) Cell cycle analysis using a flow cytometry. (B) The proportion of cells in G0/G1 phase. (C) Expression of key pluripotency genes of GFFs treated with different concentrations of 2-PCPA. Expression of key pluripotency genes in GFFs treated with 2-PCPA (0 μM) was set as 1.0. Data are presented as the mean ± SD of three independent experiments. Different superscripts represent significant difference between treated group and control group (p < 0.05). GFFs: goat fetal fibroblast cells; 2-PCPA: trans-2-Phenylcyclopropylamine.
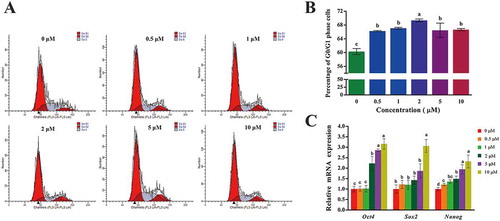
Table 1. Effect of 2-PCPA treatment on the in vitro development of goat SCNT embryos.
Figure 3. H3K4me2 levels in different stages of IVF, SCNT-C, SCNT-T embryos. (A) H3K4me2 staining of embryos from 2-cell stage to blastocyst stage (green). Nuclei were stained with DAPI (blue). (B) Fluorescence intensity of H3K4me2 was calculated relative to DAPI signal in each group. Ratio of H3K4me2 intensity to DAPI signal when IVF embryos in 2-cell stage were treated with 2-PCPA (2 μM) was set as 1.0. Data are presented as the mean ± SD of three independent experiments. Different superscripts mean significant difference (p < 0.05). H3K4me2: H3K4 dimethylation; IVF: in vitro fertilization; SCNT: somatic cell nuclear transfer; SCNT-T: SCNT treated group; SCNT-C: SCNT control group. Scale bar = 50 μm.
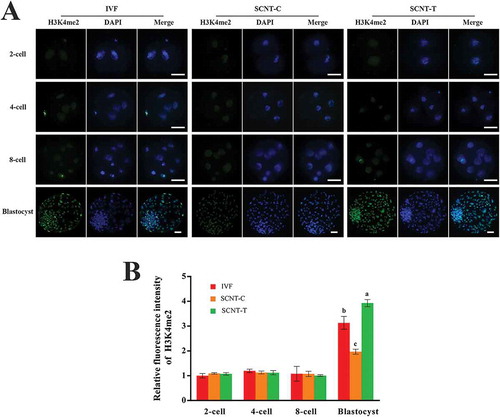
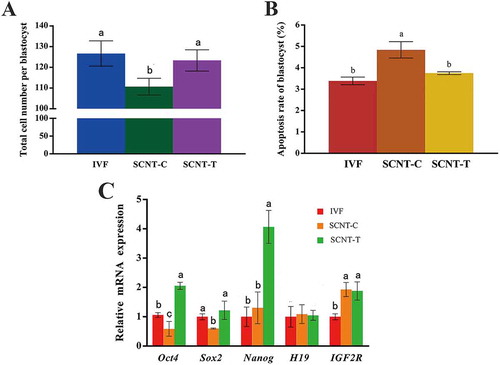
Figure 4. Blastocyst quality assessment and the mRNA expression of key pluripotency genes and imprinted genes in blastocysts. (A) Total cell number in each blastocyst was confirmed through counting nuclei. (B) Apoptosis rates of inner cells in blastocysts were obtained. (C) Relative mRNA expression of pluripotency genes Oct4, Sox2, and Nanog, imprinted genes H19 and IGF2R in IVF, SCNT-C, and SCNT-T blastocysts. Expression of key pluripotency genes in IVF embryos treated with 2-PCPA (2 μM) was set as 1.0. Data are presented as the mean ± SD of three independent experiments. Different superscripts mean significant difference (p < 0.05). IVF: in vitro fertilization; SCNT: somatic cell nuclear transfer; SCNT-T: SCNT treated group; SCNT-C: SCNT control group.