3,012
Views
29
CrossRef citations to date
0
Altmetric
Research Article

Grape seed procyanidins extract attenuates Cisplatin-induced oxidative stress and testosterone synthase inhibition in rat testes

, , , , , , , , & show all
Pages 246-259 | Received 06 Dec 2017, Accepted 11 Feb 2018, Published online: 03 Apr 2018

Figures & data

Figure 1. Protective effects of GSPE on CIS-induced basic toxicity in male rats. (A) dynamic changes of the body weight in the 5th day, 10th day and 15th day, (B) dynamic changes of the food utilization rate (the amount of weight gain/food intake × 100%) within 5 days, 10 days and 15 days, (C) alterations of the total wet weight of bilateral testes and (D) alterations of the testes coefficient to body weight (testicular wet weight/body weight). Values are expressed as mean ± standard deviation (n = 8). Data analysis was performed using multiple comparisons (LSD t-test or Dunnett’s t-test). # GSPE, CIS groups versus the control group, * CIS + GSPE groups versus the CIS group (< 0.05). CIS: Cisplatin, GSPE: grape seed procyanidins extract.

Figure 1. Protective effects of GSPE on CIS-induced basic toxicity in male rats. (A) dynamic changes of the body weight in the 5th day, 10th day and 15th day, (B) dynamic changes of the food utilization rate (the amount of weight gain/food intake × 100%) within 5 days, 10 days and 15 days, (C) alterations of the total wet weight of bilateral testes and (D) alterations of the testes coefficient to body weight (testicular wet weight/body weight). Values are expressed as mean ± standard deviation (n = 8). Data analysis was performed using multiple comparisons (LSD t-test or Dunnett’s t-test). # GSPE, CIS groups versus the control group, * CIS + GSPE groups versus the CIS group (p < 0.05). CIS: Cisplatin, GSPE: grape seed procyanidins extract.

Figure 2. Histopathological changes by PAS staining in rat testes (×400). (A1–F1) stages IV–VI of spermatogenic epithelium, (A2–F2) stage XI of spermatogenic epithelium, (A3–F3) interstitium. (A1–A3) the control group, (B1–B3) the 200 mg/kg GSPE group, (C1–C3) the CIS group, (D1–D3) the CIS + 100 mg/kg GSPE group, (E1–E3) the CIS + 200 mg/kg GSPE group and (F1–F3) the CIS + 400 mg/kg GSPE group. Damaged spermatogenic epithelial cells fell into the seminiferous tubule lumen, interstitial blood vessel hyperemia as well as vacuoles were observed in the CIS group. (n = 5),

represents damaged spermatogenic epithelial cells,
represents vacuoles, → represents interstitial blood vessel hyperemia. PAS: periodic acid-Schiff.

Figure 2. Histopathological changes by PAS staining in rat testes (×400). (A1–F1) stages IV–VI of spermatogenic epithelium, (A2–F2) stage XI of spermatogenic epithelium, (A3–F3) interstitium. (A1–A3) the control group, (B1–B3) the 200 mg/kg GSPE group, (C1–C3) the CIS group, (D1–D3) the CIS + 100 mg/kg GSPE group, (E1–E3) the CIS + 200 mg/kg GSPE group and (F1–F3) the CIS + 400 mg/kg GSPE group. Damaged spermatogenic epithelial cells fell into the seminiferous tubule lumen, interstitial blood vessel hyperemia as well as vacuoles were observed in the CIS group. (n = 5), Display full size represents damaged spermatogenic epithelial cells, Display full size represents vacuoles, → represents interstitial blood vessel hyperemia. PAS: periodic acid-Schiff.

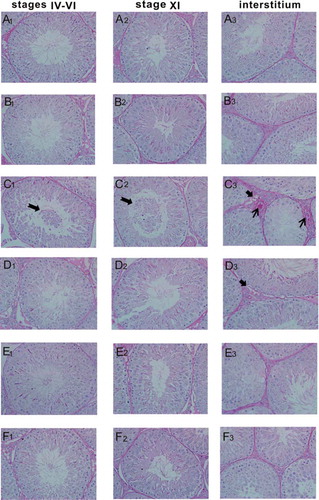
Table 1. Quantitative histological analysis of testicular tissue in stages IV–VI of seminiferous epithelium cycle in rats.

Table 2. Quantitative histological analysis of testicular tissue in stage XI of seminiferous epithelium cycle in rats.

Figure 3. Protective effects of GSPE on CIS-induced oxidative stress in rat testes. (A) •OH levels, (B) activity of SOD, (C) activity of CAT, (D) GSH levels, (E) LPO levels and (F) T-AOC levels. Values were expressed as mean ± standard deviation (n = 8). Data analysis was performed using multiple comparisons (LSD t-test or Dunnett’s t-test). # GSPE, CIS groups versus the control group, * CIS + GSPE groups versus the CIS group (< 0.05). •OH: hydroxyl radicals, SOD: superoxide dismutase, CAT: catalase, GSH: glutathione, LPO: lipid peroxidation, T-AOC: total antioxidant capacity.

Figure 3. Protective effects of GSPE on CIS-induced oxidative stress in rat testes. (A) •OH levels, (B) activity of SOD, (C) activity of CAT, (D) GSH levels, (E) LPO levels and (F) T-AOC levels. Values were expressed as mean ± standard deviation (n = 8). Data analysis was performed using multiple comparisons (LSD t-test or Dunnett’s t-test). # GSPE, CIS groups versus the control group, * CIS + GSPE groups versus the CIS group (p < 0.05). •OH: hydroxyl radicals, SOD: superoxide dismutase, CAT: catalase, GSH: glutathione, LPO: lipid peroxidation, T-AOC: total antioxidant capacity.

Figure 4. 8-OHdG levels in serum and mRNA levels of MT-1 and HO-1 in rat testes. (A) 8-OHdG levels by ELISA and (B) relative mRNA expression levels of MT-1 and HO-1 by RT-qPCR. Values were expressed as mean ± standard deviation (n = 8). Data analysis was performed using multiple comparisons (LSD t-test or Dunnett’s t-test). # GSPE, CIS groups versus the control group, * CIS + GSPE groups versus the CIS group (< 0.05). 8-OHdG: 8-hydroxy-2-deoxyguanosine, HO-1: heme oxygenase, MT-1: metallothionein-1, ELISA: enzyme linked immunosorbent assay, RT-qPCR: reverse transcription-quantitative polymerase chain reaction.

Figure 4. 8-OHdG levels in serum and mRNA levels of MT-1 and HO-1 in rat testes. (A) 8-OHdG levels by ELISA and (B) relative mRNA expression levels of MT-1 and HO-1 by RT-qPCR. Values were expressed as mean ± standard deviation (n = 8). Data analysis was performed using multiple comparisons (LSD t-test or Dunnett’s t-test). # GSPE, CIS groups versus the control group, * CIS + GSPE groups versus the CIS group (p < 0.05). 8-OHdG: 8-hydroxy-2-deoxyguanosine, HO-1: heme oxygenase, MT-1: metallothionein-1, ELISA: enzyme linked immunosorbent assay, RT-qPCR: reverse transcription-quantitative polymerase chain reaction.

Figure 5. Protective effects of GSPE on CIS-induced nitrative stress in rat testes. (A) NO levels were increased in CIS groups, and (B) activities of iNOS and TNOS were increased in CIS groups. Values were expressed as mean ± standard deviation (n = 8). Data analysis was performed using multiple comparisons (LSD t-test or Dunnett’s t-test). # GSPE, CIS groups versus the control group, * CIS + GSPE groups versus the CIS group (< 0.05). NO: nitric oxide, iNOS: inducible nitric oxide synthases, TNOS: total nitric oxide synthases.

Figure 5. Protective effects of GSPE on CIS-induced nitrative stress in rat testes. (A) NO levels were increased in CIS groups, and (B) activities of iNOS and TNOS were increased in CIS groups. Values were expressed as mean ± standard deviation (n = 8). Data analysis was performed using multiple comparisons (LSD t-test or Dunnett’s t-test). # GSPE, CIS groups versus the control group, * CIS + GSPE groups versus the CIS group (p < 0.05). NO: nitric oxide, iNOS: inducible nitric oxide synthases, TNOS: total nitric oxide synthases.

Figure 6. Concentrations of testosterone in serum by ELISA. Concentrations of testosterone decreased in CIS groups, while GSPE could reverse CIS-induced adverse effect and with a dose dependence manner. Values were expressed as mean ± standard deviation (n = 8). Data analysis was performed using multiple comparisons (LSD t-test). # GSPE, CIS groups versus the control group, * CIS + GSPE groups versus the CIS group (< 0.05).

Figure 6. Concentrations of testosterone in serum by ELISA. Concentrations of testosterone decreased in CIS groups, while GSPE could reverse CIS-induced adverse effect and with a dose dependence manner. Values were expressed as mean ± standard deviation (n = 8). Data analysis was performed using multiple comparisons (LSD t-test). # GSPE, CIS groups versus the control group, * CIS + GSPE groups versus the CIS group (p < 0.05).

Figure 7. Effects of GSPE on CIS-induced the down-regulation of testosterone synthetase mRNA levels in rat testes. (A,B) relative mRNA expression levels of Lhcgr, Scarb1, Star, Cyp11a1, Cyp17a1, Cyp19a1, Hsd3b1, and Hsd17b by RT-qPCR. Values were expressed as mean ± standard deviation (= 8). Data analysis was performed using multiple comparisons (LSD t-test or Dunnett’s t-test). # GSPE, CIS groups versus the control group, * CIS + GSPE groups versus the CIS group (< 0.05). Lhcgr: luteinizing hormone receptor, Scarb1: lipoprotein-receptor, Star: steroidogenic acute regulatory protein, Cyp11a1: P450 side chain cleavage enzyme, Cyp17a1: 17α-hydroxylase, Cyp19a1: 19α-hydroxylase, Hsd3b1: 3β-hydroxysteroid dehydrogenase, Hsd17b: 17β-hydroxysteroid dehydrogenase.

Figure 7. Effects of GSPE on CIS-induced the down-regulation of testosterone synthetase mRNA levels in rat testes. (A,B) relative mRNA expression levels of Lhcgr, Scarb1, Star, Cyp11a1, Cyp17a1, Cyp19a1, Hsd3b1, and Hsd17b by RT-qPCR. Values were expressed as mean ± standard deviation (n = 8). Data analysis was performed using multiple comparisons (LSD t-test or Dunnett’s t-test). # GSPE, CIS groups versus the control group, * CIS + GSPE groups versus the CIS group (p < 0.05). Lhcgr: luteinizing hormone receptor, Scarb1: lipoprotein-receptor, Star: steroidogenic acute regulatory protein, Cyp11a1: P450 side chain cleavage enzyme, Cyp17a1: 17α-hydroxylase, Cyp19a1: 19α-hydroxylase, Hsd3b1: 3β-hydroxysteroid dehydrogenase, Hsd17b: 17β-hydroxysteroid dehydrogenase.

Figure 8. GSPE up-regulated protein expression levels of the key testosterone synthetase in rat testes. (A) STAR, CYP11A1 and HSD17B contents determined by Western blot, and (B) semiquantitative analysis of protein expression levels by IPP. Values were expressed as mean ± standard deviation (n = 5). Data analysis was performed using multiple comparisons (LSD t-test or Dunnett’s t-test). # GSPE, CIS groups versus the control group, * CIS + GSPE groups versus the CIS group (< 0.05). STAR: steroidogenic acute regulatory protein, CYP11A1: P450 side chain cleavage enzyme, HSD17B: 17β-hydroxysteroid dehydrogenase.

Figure 8. GSPE up-regulated protein expression levels of the key testosterone synthetase in rat testes. (A) STAR, CYP11A1 and HSD17B contents determined by Western blot, and (B) semiquantitative analysis of protein expression levels by IPP. Values were expressed as mean ± standard deviation (n = 5). Data analysis was performed using multiple comparisons (LSD t-test or Dunnett’s t-test). # GSPE, CIS groups versus the control group, * CIS + GSPE groups versus the CIS group (p < 0.05). STAR: steroidogenic acute regulatory protein, CYP11A1: P450 side chain cleavage enzyme, HSD17B: 17β-hydroxysteroid dehydrogenase.

Table 3. Primer sequences and theoretical amplification length.

Reprints and Corporate Permissions

Please note: Selecting permissions does not provide access to the full text of the article, please see our help page How do I view content?

To request a reprint or corporate permissions for this article, please click on the relevant link below:

Academic Permissions

Please note: Selecting permissions does not provide access to the full text of the article, please see our help page How do I view content?

Obtain permissions instantly via Rightslink by clicking on the button below:

If you are unable to obtain permissions via Rightslink, please complete and submit this Permissions form. For more information, please visit our Permissions help page.