
Figures & data
Table 1. Clinical characteristics of the study participants.
Figure 1. 1H CPMG (Carr-Purcell-Meiboom-Gill) NMR spectrums (δ 0 to 8.5 ppm) recorded at 600 MHz and 298 K of follicular fluid samples from the study subjects. A) 1H NMR spectrum of control sample. B) 1H NMR spectrum of patient sample. C) 1H NMR spectrum of follicular fluid contaminated with flushing medium [HEPES [4-(2-Hydroxyethyl)-1-piperazineethanesulfonic acid].
![Figure 1. 1H CPMG (Carr-Purcell-Meiboom-Gill) NMR spectrums (δ 0 to 8.5 ppm) recorded at 600 MHz and 298 K of follicular fluid samples from the study subjects. A) 1H NMR spectrum of control sample. B) 1H NMR spectrum of patient sample. C) 1H NMR spectrum of follicular fluid contaminated with flushing medium [HEPES [4-(2-Hydroxyethyl)-1-piperazineethanesulfonic acid].](/cms/asset/09408c91-5531-424a-82f2-c4be2e3e184e/iaan_a_1478469_f0001_oc.jpg)
Figure 2. Multivariate statistical analysis results of the data including both the HEPES contaminated samples and samples without any contamination. Principal component analysis (PCA) scores (A) and loadings (B) plots and partial least squares discriminant analysis (PLS-DA) scores (C) and variable importance in projection (VIP) values (D) for the follicular fluid (FF) spectral data including both the contaminated samples and samples without any contamination.For the PCA, the first component accounts for 39.1407% of overall variability and the second component accounts for 19.7594% of overall variability which corresponds to a cumulative R2 value of 0.5890. The PLS-DA model has R2X value of 0.5586, R2Y value of 0.8788 and Q2 value of 0.8240. PLS-DA model shows a better separation for the endometriosis and control FF spectral data when compared to the PCA model. In the PCA loadings plot (B) and PLS-DA VIP plot (D), lactate (1.25 ppm, 4.03 ppm), β-glucose (4.55 ppm, 3.15–3.84 ppm), valine (0.95 ppm, 0.89 ppm), pyruvate (2.29 ppm) and HEPES peaks (2.55–3.06 ppm) are highlighted as important peaks.
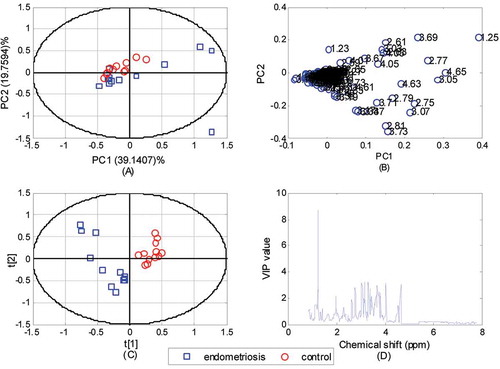
Figure 3. Multivariate statistical analysis results of the data including only samples without any contamination. Principal component analysis (PCA) scores (A) and loadings (B) plots and partial least squares discriminant analysis (PLS-DA) scores (C) and variable importance in projection (VIP) values (D) for the follicular fluid (FF) spectral data including samples without any contamination.For the PCA, the first component accounts for 43.41% of overall variability and the second component accounts for 21.70% of overall variability which corresponds to a cumulative R2 value of 0.6511. The PLS-DA model has R2X value of 0.5381, R2Y value of 0.9723 and Q2 value of 0.9239. Both models show a good separation for the endometriosis and control FF spectral data. The PCA loadings plot (B) and PLS-DA VIP plot (D) show that this separation occurs mainly because of lactate (1.25 ppm, 4.03 ppm), β-glucose (4.55 ppm, 3.15–3.84 ppm), valine (0.95 ppm, 0.89 ppm) and pyruvate (2.29 ppm) peaks.
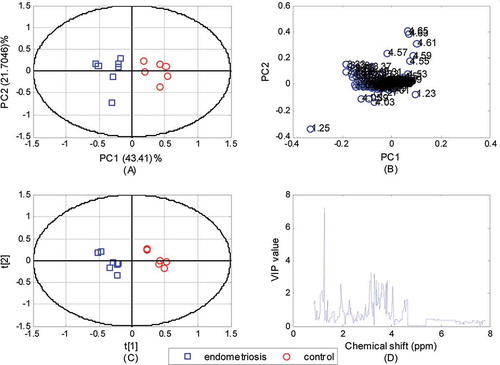
Table 2. Resonance assignments and concentration ranges of metabolites in ovarian endometrioma and control follicular fluid samples.