Figures & data
Figure 1. PFOS, PFOA, and PFNA do not induce apoptosis in spermatogenic cells derived from hESCs. (A) Flow cytometry analyses for indicating percent viable cells, percent early apoptotic cells, percent late apoptotic cells, and percent dead/necrotic cells for the highest concentrations of PFOS, PFOA, and PFNA assessed plus a negative control. Lower left quadrant represents viable cells, lower right quadrant represents early apoptotic cells, upper right quadrant is late apoptotic/dead cells, and the upper right quadrant is dead/necrotic cells. (B–D) Graphical representation showing that exposure to PFOS, PFOA, and PFNA did not impact cell viability in hESCs differentiated in in vitro spermatogenic conditions. 5,000 events were analyzed, with four (n = 4) replications performed for each condition. Significant changes in cell viability were determined using a 1-way analysis of variance (1-way ANOVA) and validated via a Student’s t-test, where * is p < 0.05, ** is p < 0.01, and *** is p < 0.001.
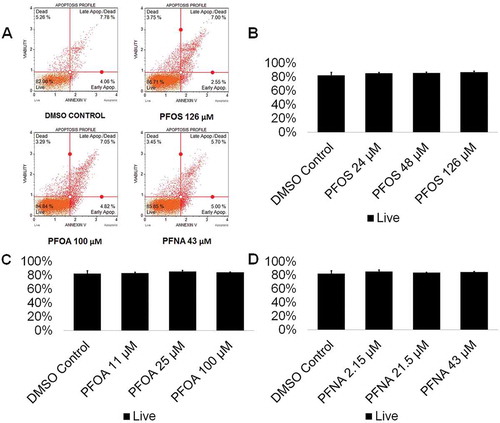
Figure 2. PFOS, PFOA, PFNA, and a mixture of PFASs decrease ROS generation in spermatogenic cells derived from hESCs. (A) Flow-cytometry-based analysis of DHE labeling reporting percent ROS- and percent ROS+ cells for the highest concentrations tested plus a negative control. Blue indicates ROS-. Red indicates ROS+. (B–E) Graphical representation showing that PFOS, PFOA, PFNA, and a mixture of the PFASs PFOS, PFOA, and PFNA (PFAS mixture) decrease ROS generation in hESCs differentiated in in vitro spermatogenic conditions. 5,000 events were analyzed, with five (n = 5) replications performed for each condition. Significant changes in ROS generation were determined using a 1-way analysis of variance (1-way ANOVA) and validated via a Student’s t-test, where * is p < 0.05, ** is p < 0.01, and *** is p < 0.001.
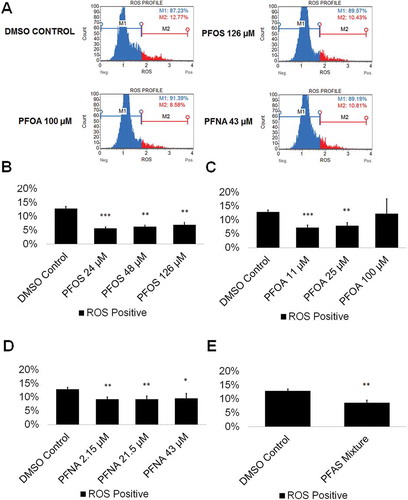
Figure 3. PFOS, PFOA, PFNA, and a mixture of PFASs do not impact mitochondrial membrane potential in spermatogenic cells derived from hESCs. (A) Flow cytometry analyses for the highest concentrations tested plus a negative control indicating percent live cells, percent a depolarized/live cells, percent depolarized/dead cells, and percent dead cells. Lower right quadrant represents viable cells, lower left quadrant represents depolarized/live cells, upper right quadrant is depolarized/dead cells, and the upper right quadrant is dead cells. (B–E) Graphical representation showing that PFOS, PFOA, PFNA, and a mixture of the PFASs PFOS, PFOA, and PFNA (PFAS mixture) do not impact mitochondrial membrane potential in hESCS differentiated in in vitro spermatogenic conditions. 5,000 events were analyzed, with four (n = 4) replications performed for each condition. Significant changes in mitochondrial membrane potential were determined using a 1-way analysis of variance (1-way ANOVA) and validated via a Student’s t-test, where * is p < 0.05, ** is p < 0.01, and *** is p < 0.001.
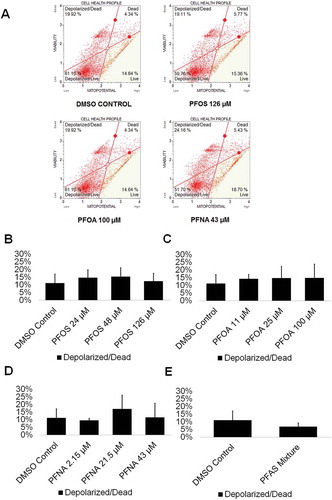
Figure 4. PFOS, PFOA, and PFNA do not affect the cell cycle or haploid cell viability in spermatogenic cells derived from hESCs. (A) Flow cytometry analyses of cell cycle profiles following treatment with the highest concentrations of PFOS, PFOA, and PFNA plus a negative control. Green, blue, purple, and beige populations on flow cytometry correspond to haploid, G0/G1, S, and G2 phases, respectively. (B–D) Graphical representation showing that PFOS, PFOA, and PFNA do not affect the cell cycle of actively dividing hESCS differentiated in in vitro spermatogenic conditions. (E–G) Graphical representation showing that exposure to PFOS, PFOA, and PFNA does not impact the percentage of haploid cells in spermatogenic cells derived from hESCs. 5,000 events were analyzed, with three (n = 3) replications performed for each condition. Significant changes in percentages of haploid cells and cells in G0/G1, S phase, and G2 were determined using a 1-way analysis of variance (1-way ANOVA) and validated via a Student’s t-test, where * is p < 0.05, ** is p < 0.01, and *** is p < 0.001.
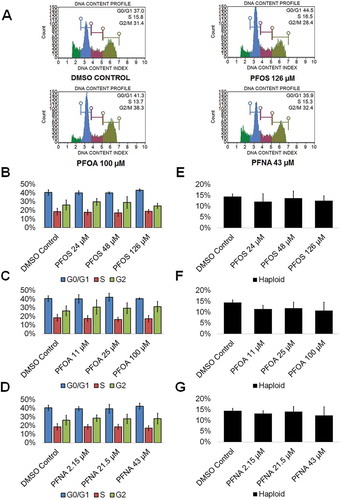
Figure 5. PFOS, PFOA, and PFNA impact PLZF area and intensity in spermatogonia derived under in vitro spermatogenic conditions. (A) Representative 5× images obtained by the Cellomics ArrayScan VT1 of PLZF + (green) and DAPI (blue)-stained colonies treated with the highest concentrations of PFOS, PFOA, and PFNA plus a negative control. All images are taken under the same imaging conditions and parameters. (B–D) Graphical representation showing that PFOS and PFNA reduce average total PLZF+ area in spermatogonia derived under in vitro spermatogenic conditions. (E–G) Graphical representation showing that PFOS and PFOA reduce average total PLZF+ intensity in spermatogonia. Three (n = 3) replications were performed for each condition. Significant changes in PLZF+ area and intensity were determined using a 1-way analysis of variance (1-way ANOVA) and validated via a Student’s t-test, where * is p < 0.05, ** is p < 0.01, and *** is p < 0.001.
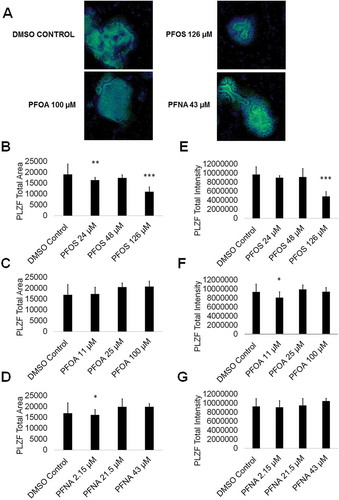
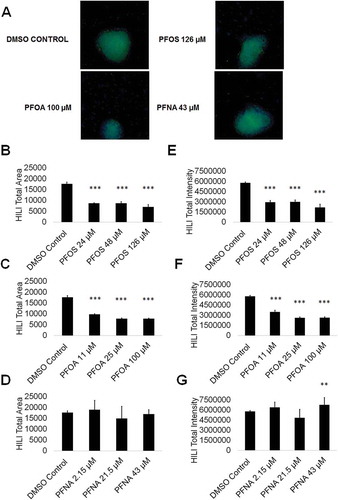
Figure 6. PFOS, PFOA, and PFNA influence HILI area and intensity in primary spermatocytes derived under in vitro spermatogenic conditions. (A) Representative 5× images obtained by the Cellomics ArrayScan VT1 of HILI + (green) and DAPI (blue)-stained colonies treated with the highest concentrations of PFOS, PFOA, and PFNA plus a negative control. All images are taken under the same imaging conditions and parameters. (B–D) Graphical representation showing that PFOS and PFOA exposure impacts average total HILI+ area in primary spermatocytes derived under in vitro spermatogenic conditions. (E–G) Graphical representation showing that exposure to PFOS, PFOA, and PFNA impacts average total HILI+ intensity in primary spermatocytes. Three (n = 3) replications were performed for each condition. Significant changes in HILI+ area and intensity were determined using a 1-way analysis of variance (1-way ANOVA) and validated via a Student’s t-test, where * is p < 0.05, ** is p < 0.01, and *** is p < 0.001.