Figures & data
Table 1. Study characteristics, values are expressed as mean ± SD.
Table 2. Average amount of HptA1 (and standard deviation) based on the clinical outcomes and the results of the related statistical analysis.
Figure 1. Study outline of the main assay steps (A) and the data analysis (B). Spent culture medium samples were stored frozen at –80°C until the haptoglobin alpha-1 assay.
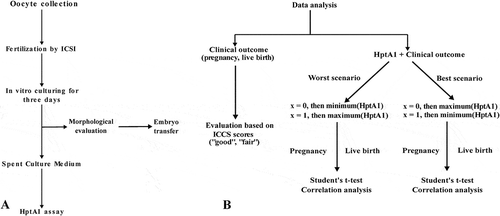
Table 3. Number of pregnancies and no-pregnancies based on ICCS scores and the HptA1 categories. In the parentheses the live birth (or no live birth) data are also shown, where there is no parentheses the values were the same.
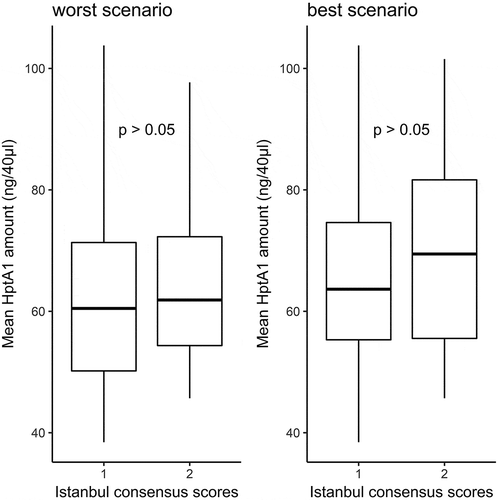
Figure 2. Average HptA1 amounts in ICCS groups (1 ‘good’ and 2 ‘fair’) analyzed with Student’s t-test, in case of the worst and the best scenarios.