Figures & data
Figure 1. Experimental design. GD: gestational day; ICW: immersion in cold water; PND: postnatal day; C: control group; PS: prenatal stress group; E2: estradiol; P4: progesterone.
Figure 2. Daily body weight gain in control and stressed dams. Stressed dams gained less body weight from gestational day 15 to delivery (day 23). The regression lines of daily body weight for control and stressed dams are shown. Correlation coefficient for control curve: 0.9842; ANOVA for prediction: 13.16, p = 0.008. Correlation coefficient for PS curve: 0.9435; ANOVA for prediction: 64.92, p = 0.0001. The slopes indicate the average increase in body weight per day, and that of the stressed dams were significantly lower than that of control dams (p = 0.01), which. N = 10 per group.
Figure 3. Representative estrous cycles of control and prenatally stressed (PS) females during adulthood for three consecutive weeks. PS caused enlarged cycles with absence of diestrus periods, as well as an increase of days in estrus or proestrus. Estrus (E), Metestrus (M), Diestrus (D), Proestrus (P).
Figure 4. Photomicrographs of ovaries from control (A) and prenatally stressed females (B). Ovaries from prenatal stressed females (PS) showed few mature follicles compared with control ovaries. Uterine epithelia from control (C) and PS females (D). Epithelial height was lower in PS compared with control uteri. Magnification: 40× for ovaries and 1000× for uteri. (e) Ovarian relative weight (ORW) and uterine relative weight (URW). Number of mature follicles and corpora lutea observed in ovaries of control and PS female rats in proestrus and diestrus stages. Data shown as Means ± SDM. Different letters indicate significant differences with the respective control, p = 0.05.
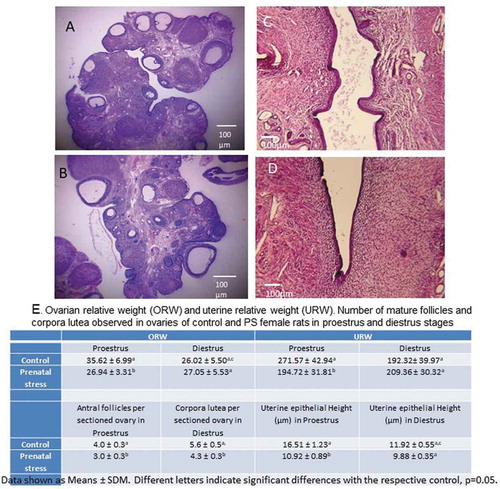
Figure 5. TUNEL-positive cells in testicular sections from control and prenatally stressed (PS) males. (A) and (C): control testes; (B) and (D): seminiferous tubules from a PS male. The number of TUNEL-positive cells (arrows) observed in seminiferous epithelium were bigger in PS than in control males. (A) and (B): confocal microscopy; (C) and (D): light microscopy microphotographs showing TUNEL-positive cells, mainly Spermatocytes (arrows). Magnification in panels (A) and (B): 100×; magnification in (C) and (D): 1000×. (E) Percentage of seminiferous tubules with TUNEL-positive testicular germ and Leydig cells in control and prenatally stressed males. Data shown as Means ± SDM. Chi-square test for percentages; student’s t test for numbers. Different letters indicate differences from control group, × = 0.05.
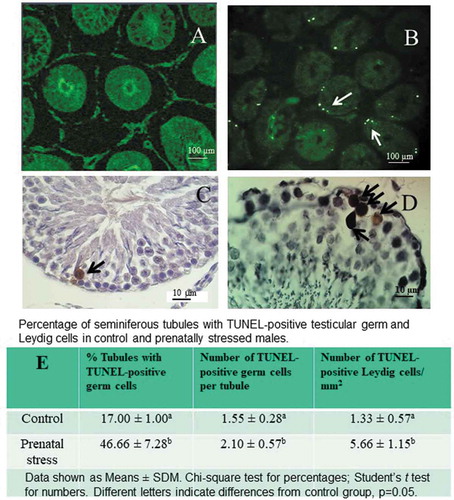
Figure 6. Percentages of pregnant control (C) and prenatally stressed (PS) females (A). Lower percentages of pregnancy were obtained in control and PS females after copulating with PS males. X2 followed by Fisher exact probability test. (B): the number of offspring born from control or PS mothers copulating with PS males was significantly lower. Two-way ANOVA followed by Newman-Keuls. Data shown as Mean ± S.D.M. *p = 0.05 compared with C-C group.