Figures & data
Table 1. Body and organ weights. Values are expressed as mean ± SD, n = 8 in each group.
Figure 1. Effects of MSG on sperm (A) count, percentages of (B) motility, (C) abnormal morphology, and (D) viability. ap < 0.05, as compared to normal control group, bp < 0.05, as compared to 60 mg/kg group.
Figure 2. Comparison of normal and abnormal sperm morphology, X400. (A and B) Show normal sperm morphology; hook head and long tail. (C) Shows abnormal tailless sperm. (D) Depicts a bend at a point on the sperm tail. (E–G) Show abnormally developed sperm head; knobbed, short and no hook, and bent sperm head, respectively. Sperm were stained with Diff-Quik staining kit.
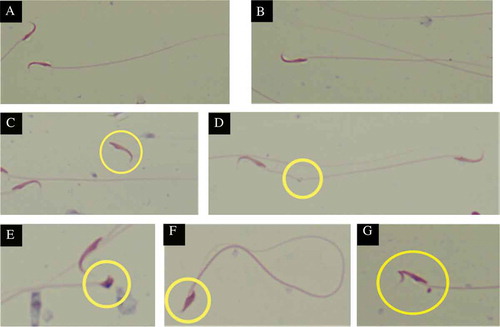
Figure 3. Effects of MSG on the levels of (A) luteinizing hormone (LH), (B) follicle stimulating hormone (FSH), and (C) testosterone levels. ap < 0.05, as compared to normal control group.
Figure 4. Effects of MSG on the levels of (A) superoxide dismutase (SOD) activity, (B) reduced glutathione (GSH), (C) malondiadehyde (MDA), and (D) advanced oxidation protein products (AOPP) of the testis. ap < 0.05, as compared to normal control group, bp < 0.05, as compared to 60 mg/kg group.
Figure 5. Testicular cross sections of rats, stained with H&E. (A) Testis section of control group (NC), showing normal histological structure of seminiferous tubules (St) containing spermatocytes and late spermatids in the lumen, X100. (B) At higher magnification, the seminiferous epithelium consisting of spermatogonia (SG), spermatocytes and spermatids (SD) can be observed clearly, X400. (C) The effect of MSG treatment at 60 mg/kg is not significant as the normal histostructure of the testis is not disturbed, X100. (D) The seminiferous epithelium is also well intact, X400. (E) However, at the dose of 120 mg/kg, MSG treatment caused deformation to the seminiferous tubules, where some of the seminiferous tubules showed atrophied epithelium layer, X100. (F) At higher magnification, the damage is even more obvious with the loss of spermatocytes and thinning of the epithelium layer, X400.
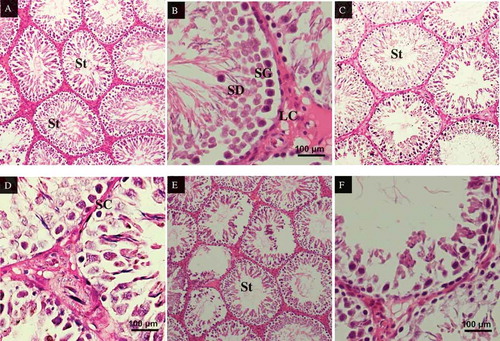
Figure 6. Epididymis cross-sections of rats, stained in H&E. (A) Epididymis of rats in control group, X100s. Epididymis layered by pseudostratified epithelium (Ep). A packed mass of spermatozoa (Sz) were seen in control group within the lumen of the epididymis. (B) Epididymis of rats in control group, X400. Epididymis layered by pseudostratified epithelium (Ep). A packed mass of spermatozoa (Sz) were seen in control group within the lumen of the epididymis. (C) Epididymis of rats in MSG60 group, X100. The epididymis showed reduced in spermatozoa (Sz) mass within the lumen. (D) Epididymis of rats in MSG120 group, X400. The epididymis showed reduced in spermatozoa (Sz) mass within the lumen. (E) Epididymis of rats in MSG120 group, X100. MSG 120 groups revealed reduced mass of spermatozoa (Sz) compared to MSG60 and control group. (F) Epididymis of rats in MSG120 group, X400. Alteration in epithelium (Ep) cells lining the epididymis in which nucleus appear irregular. Mass of spermatozoa (Sz) greatly reduced compared to MSG60 and control group.
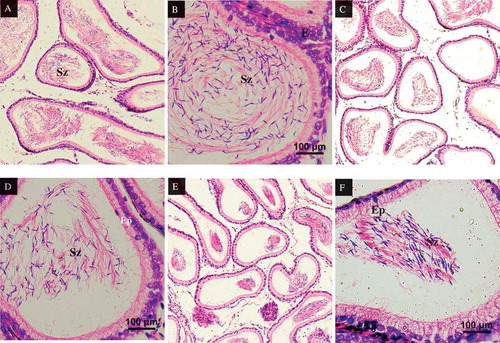
Figure 7. Prostate cross-sections of rats, stained in H&E. (A) Prostate gland of rats in control group, X100. The lumen contains prostatic fluid (PF). The glandular epithelium (Ep) are lined with simple to pseudostratified to columnar epithelium. (B) Prostate gland of rats in control group, X400. The lumen contains prostatic fluid (PF) and the glandular epithelium (Ep) are lined with simple to pseudostratified to columnar epithelium cells. (C) Prostate gland of rats in MSG60 group, X100. Atrophy of the prostate lumen compared to control group was observed. (D) Prostate gland of rats in MSG60 group, X400. No changes in the glandular epithelium cells (E) as the cells are still in intact. (E) Prostate gland of rats in MSG120 group, X100. Prostatic fluid in the lumen of the prostate gland is greatly reduced in MSG120 group compared to MSG 60 and control groups. (F) Prostate gland of rats in MSG120 group, X400. Epithelium of prostate in MSG120 rats appear thinner and less folded when compared with the MSG60 and control groups.
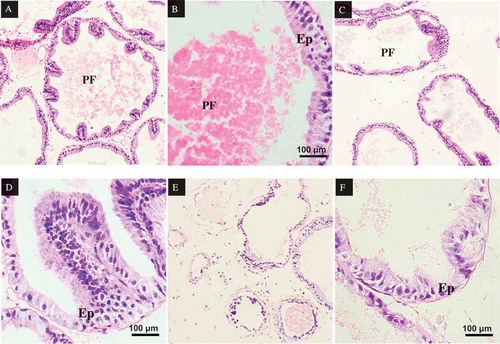
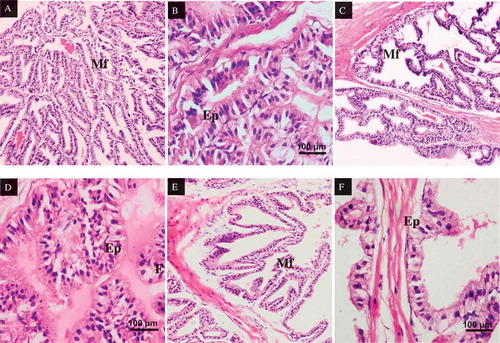
Figure 8. Seminal vesicle cross-sections of rats, stained in H&E. (A) Seminal vesicle of rats in control group, X100. Mucous layer are thin in structure, branching out and folded to form an uneven anastomos branches (Mf). (B) Seminal vesicle of rats in control group, X400. The epithelium of seminal vesicle also consists of closely arranged columnar cells. (C) Seminal vesicle of rats in MSG60 group, X100. The mucosal folding (Mf) decreases compared to the control group. (D) Seminal vesicle of rats in MSG60 group, X400. The cell structure arrangements observed to be irregular and uneven in the epithelium lining. (E) Seminal vesicle of rats in MSG120 group, X100. Decrease in number of mucosal folding (Mf) compared to the control MS 60 groups. (F) Seminal vesicle of rats in MSG120 group, X400. The cell structure arrangements observed to be irregular and uneven in the epithelium (Ep) lining of MSF120 group compared to MSG60 and control groups.