Figures & data
Table 1. Overview of sperm parameters according to semen quality.
Table 2. Overview of sperm parameters according to the HDS.
Table 3. Summary of Spearman’s rank correlations between %HDS and other sperm parameters.
Table 4. Summary of Spearman’s rank correlations between H3K4me2 and other sperm parameters.
Figure 1. Representative images of the subcellular localization of H3K4me2 in sperm. A) Immunocytochemical localization of H3K4me2 and negative control. B) Difference in H3K4me2 abundance between high and low HDS samples, as determined by western blot densitometry, with an anti-alpha tubulin antibody as a loading control. The data are expressed as means, including min–max whiskers, and different superscripts indicate statistical significance (p < 0.05). HDS, high DNA stainability index.
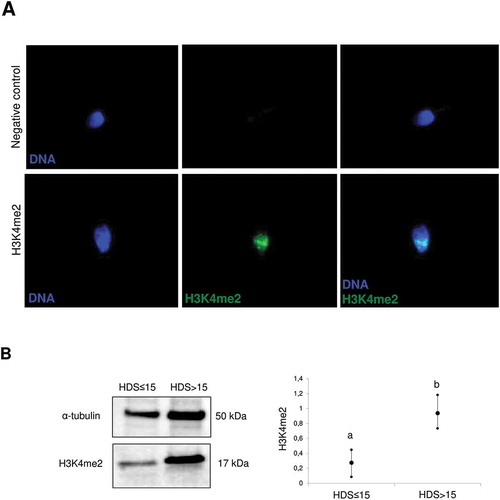
Figure 2. Relationship between H3K4me2 labeling and semen quality or chromatin maturity. A) Representative images of H3K4me2 histograms generated by flow cytometry, including a normospermic sample with HDS ≤ 15; B) and a sample with pathological semen quality and HDS > 15. C) Comparison of H3K4me2 fluorescence intensity between normozoospermic (N), asthenozoospermic (A), and oligoasthenozoospermic (OA) samples; D) and between samples with HDS ≤ 15 and HDS > 15. The data are expressed as medians and appropriate quartiles, and different superscripts indicate statistical significance (p < 0.05). HDS, high DNA stainability index; DFI, DNA fragmentation index.
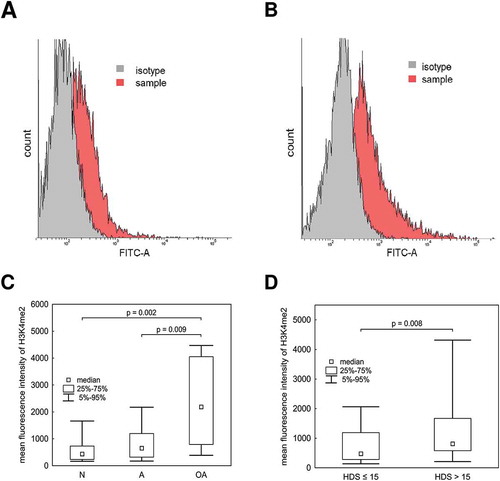
Figure 3. Relationship between semen quality and DNA fragmentation or chromatin maturity measured by SCSA. A) Representative histograms and scatter diagrams of the SCSA results for samples with HDS ≤ 15; B) and HDS > 15; C) Comparison of %DFI; D) and %HDS between normozoospermic (N), asthenozoospermic (A), and oligoasthenozoospermic (OA) samples. The data are expressed as medians and appropriate quartiles, and different superscripts indicate statistical significance (p < 0.05). HDS, high DNA stainability index; DFI, DNA fragmentation index.