Figures & data
Figure 1. Quantitative fluorescence multiplex PCR results and the TSPY/TSX ratio. (A). Analyses of Y and X chromosome-specific gene regions of TSPY, RActβ and TSX genes in the rat sperm genome in unirradiated (n = 7) and irradiated (n = 7) groups in the presence of a female genomic DNA sample. PCR products amplified using individual primer pairs designed for TSPY, RActβ and TSX genes were separated by capillary electrophoresis to determine the estimated sizes. The PCR products were labeled with FAM. Peak heights were used to quantify the results. The x-axis shows amplicon sizes and the y-axis shows the relative fluorescence unit derived from the number of amplicons of the target region. It was confirmed by the DNA sample in the peripheral blood of the female rat that there was no amplification in the TSPY specific region. Representative electrophoretic data is shown for one rat from each group are shown. Four replicates were analysed for each rat. (B). Ratio of TSPY/TSX relative fluorescence unit in rat sperm samples. The ratio of TSPY/TSX relative fluorescence unit in rat sperm samples in the unirradiated and irradiated groups obtained after irradiation. The data in the bar graph shows the mean ± standard deviation values of four replicate assays conducted for each rat. Data were analyzed using the unpaired t-test. p = 0.38. FAM: fluorescein amidite, PCR: polymerase chain reaction, RActβ: rat actin beta, TSPY: testis-specific protein Y-linked, TSX: testis-specific X-linked.
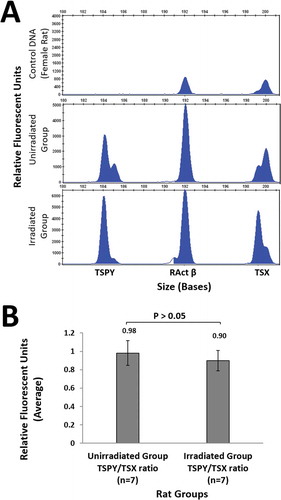
Table 1. Sex and total number of offspring in both groups.
Figure 2. Histopathological evaluation of seminiferous tubules. (A) (x200). Seminiferous tubules (St) demonstrated normal structure in sections from the unirradiated group. In addition, spermatogonia (Spg), primary spermatocytes (PS), spermatids (Spt), Sertoli cells (SC) and Leydig cell (LC) is typically visible in the seminiferous tubules (St). (B) (x200). Sections from the irradiated group show moderate damage were seen in the testis tissue. Vascular congestion (arrowhead) and edematous fields (*) can be seen in interstitial areas.
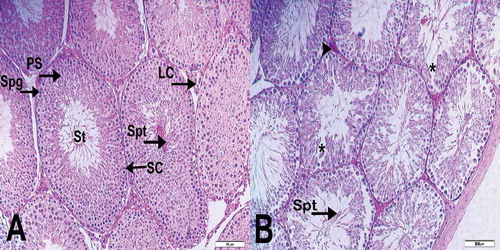
Table 2. Caspase-3- and TUNEL-positive density.
Figure 3. Light microscopy image of Caspase-3 staining. (A) (x400). Unirradiated group sections show normal spermatogonium (spgn) and primary spermatocytes (ps). Seminiferous tubule (st). (B) (x400). Irradiated group sections show Caspase-3-positive spermatogonium (black arrow) and primary spermatocytes (blue arrow).
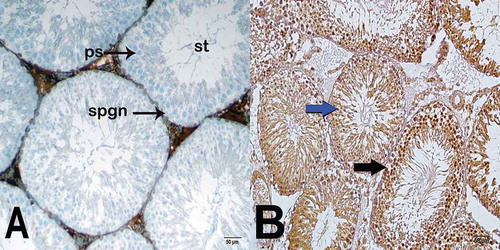
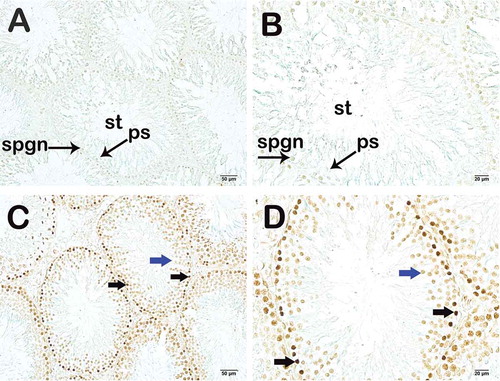
Figure 4. Light microscopy image of TUNEL staining. (A) (x200) – (B) (x400). Unirradiated group sections show normal spermatogonium (spgn) and primary spermatocytes (ps). Seminiferous tubule (st). (C) (x200) – (D) (x400). Irradiated group sections show apoptotic spermatogonium (black arrow) and primary spermatocytes (blue arrow).