Figures & data
Table 1. Expression of differentially expressed proteins in the ovarian endometriotic cyst group compared to the other two group.
Figure 1. Gene ontology (GO) functional classification and enrichment analysis of differentiated expressed proteins. (A) The ovarian endometric cysts vs. simple cysts; (B) The control group vs. ovarian endometric cysts. The x-axis indicates the functional description of the GO classifications, the left y-axis represents the proportion of the number of proteins annotated to the GO database. All GO terms are grouped into three major categories: Red is for biological processes, purple is for cellular components and orange is for molecular function.
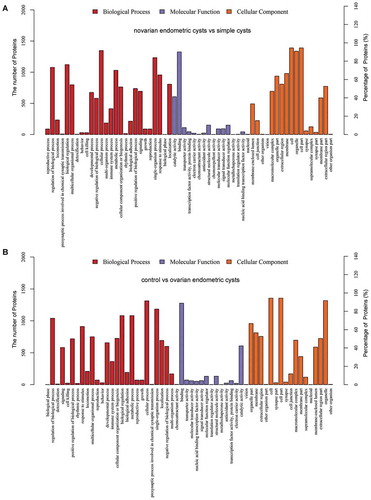
Figure 2. Kyoto Encyclopedia of Genes and Genomes (KEGG) classifications and pathway enrichment analysis of differentiated expressed proteins. (A) The ovarian endometric cysts vs. simple cysts; (B) The control group vs. ovarian endometric cysts. The x-axis indicates the functional description of the KEGG classifications, the left y-axis represents the percentage of the sequences annotated to the KEGG database. The yellow bar is for Difference Set and ble is for Reference Set.
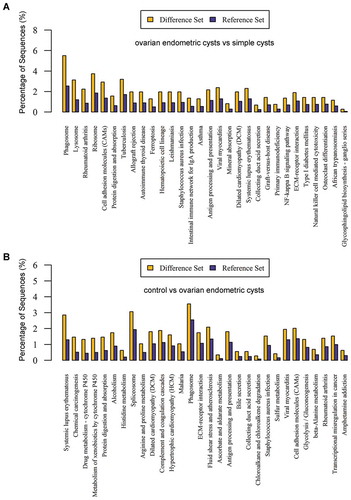
Figure 3. Heat map and Volcano Plot for protein clustering analysis. (A, C) The ovarian endometric cysts (B1, B2, B3) vs. the simple cysts group (C1, C2, C3); (B, D) the ovarian endometric cysts group (B1, B2, B3) vs. the control group (A1, A2, A3). The red indicates up regulation while blue denotes down regulation. The depth of color represents the degree of level change.
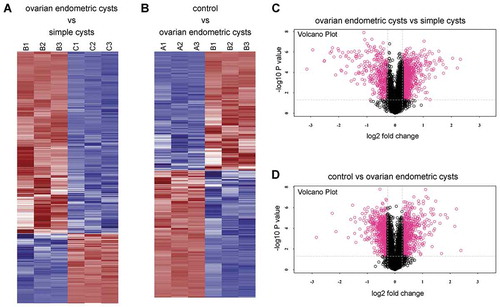
Table 2. Proteins in the ovarian endometriotic cyst group that showed a > 2-fold increase.
Table 3. The expression rates of differentially expressed proteins in found in the cyst wall tissues of the ovarian endometriotic cyst recurrent group, n (%).
Table 4. The expression rates of differentially expressed proteins in the ovarian endometriotic cyst recurrent and non-recurrent groups, n (%).
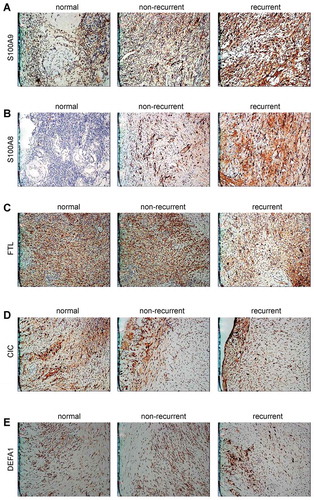
Figure 4. Verification of proteins expression level by immunohistochemistry. Expression of S100A9 (A), S100A8 (B), FTL (C), CIC (D), DEFA1 (E) in normal group, non-recurrent group of ovarian endometriosis cyst and recurrent group of ovarian endometriosis cyst; (DAB development, ×200).