1,348
Views
10
CrossRef citations to date
0
Altmetric
Clinical: Research Communication

Early and late paternal effects of reactive oxygen species in semen on embryo development after intracytoplasmic sperm injection

ORCID Icon, ORCID Icon, , , , , , , & ORCID Icon show all
Pages 122-128 | Received 10 Sep 2019, Accepted 19 Dec 2019, Published online: 16 Feb 2020

Figures & data

Table 1. Patients’ characteristics and semen analyses (n = 77).

Figure 1. Experimental Design (A) Flowchart of how the eggs and embryos were divided into groups for between-group comparisons; the fertilized and nonfertilized groups and the good-cleavage-embryo and non-developed-embryo groups were compared. (B) Flowchart of how the fertilized embryos were divided to compare the good-quality-blastocyst and poor-quality-embryo groups.

Figure 1. Experimental Design (A) Flowchart of how the eggs and embryos were divided into groups for between-group comparisons; the fertilized and nonfertilized groups and the good-cleavage-embryo and non-developed-embryo groups were compared. (B) Flowchart of how the fertilized embryos were divided to compare the good-quality-blastocyst and poor-quality-embryo groups.

Table 2. Comparison of ROS levels in semen between the fertilized and nonfertilized groups.

Table 3. Comparison of ROS levels in semen between the good-cleavage-embryo and non-developed-embryo groups.

Figure 2. Comparison of reactive oxygen species (ROS) levels (A) Comparison of reactive oxygen species (ROS) levels between the fertilized and nonfertilized eggs. The mean (± standard error) ROS levels were not significantly different between the fertilized and nonfertilized groups (P = 0.858). (B) Comparison of ROS levels between the good-cleavage-embryo and non-developed-embryo groups. The ROS level was higher in the non-developed-embryo group than in the good-cleavage-embryo group, which was statistically significant (P = 0.0026). (C) Comparison of ROS levels between the good-quality-embryo and poor-quality-embryo groups. The ROS level was lower in the good-quality-blastocyst group than in the poor-quality-embryo group, which was statistically significant (P = 0.015).
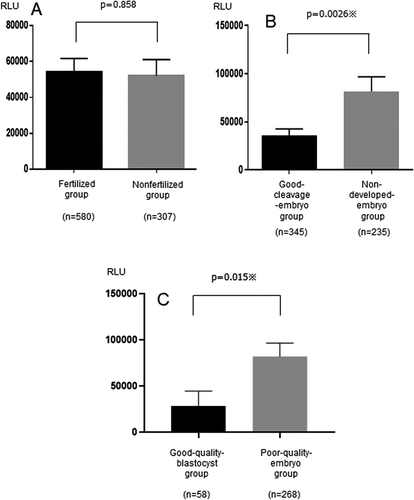
Figure 2. Comparison of reactive oxygen species (ROS) levels (A) Comparison of reactive oxygen species (ROS) levels between the fertilized and nonfertilized eggs. The mean (± standard error) ROS levels were not significantly different between the fertilized and nonfertilized groups (P = 0.858). (B) Comparison of ROS levels between the good-cleavage-embryo and non-developed-embryo groups. The ROS level was higher in the non-developed-embryo group than in the good-cleavage-embryo group, which was statistically significant (P = 0.0026). (C) Comparison of ROS levels between the good-quality-embryo and poor-quality-embryo groups. The ROS level was lower in the good-quality-blastocyst group than in the poor-quality-embryo group, which was statistically significant (P = 0.015).

Table 4. Comparison of ROS levels in semen between the good-quality-blastocyst and poor-quality-embryo groups.

Supplemental material

Supplemental Material

Download Zip (462.6 KB)

Data availability statement

The data that support the findings of this study are available upon request from the corresponding author, TT.

Reprints and Corporate Permissions

Please note: Selecting permissions does not provide access to the full text of the article, please see our help page How do I view content?

To request a reprint or corporate permissions for this article, please click on the relevant link below:

Academic Permissions

Please note: Selecting permissions does not provide access to the full text of the article, please see our help page How do I view content?

Obtain permissions instantly via Rightslink by clicking on the button below:

If you are unable to obtain permissions via Rightslink, please complete and submit this Permissions form. For more information, please visit our Permissions help page.