Figures & data
Table 1. AgNP toxicity in some sperm species.
Figure 1. AgNP concentration by optical density. A) Calibration curve to determine AgNP concentrations from commercial AgNPs (SIGMA-Aldrich). B) Spectra of AgNPs obtained from Ag+ reduction at 420 nm.
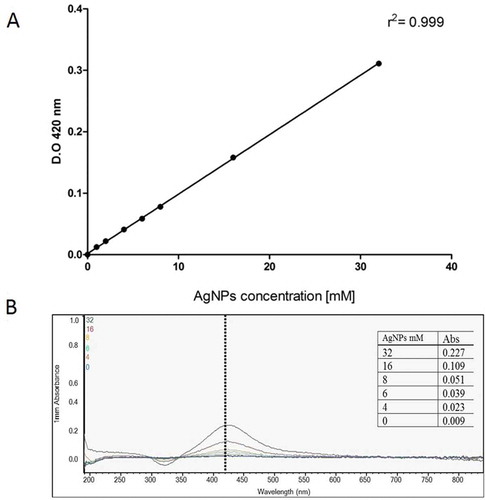
Figure 2. S. aureus growth assessed by the BactiterGlo test. Bacterial viability is proportional to relative light units (RLUs). Antibiotics were used as controls, amikacin (AMK) [30 μg/ml], cefallotin (CF) [30 μg/ml], and cefuroxime (CXM) [30 μg/ml]. Bacteria were incubated for 24 hours at 37°C after treatments and evaluated. Different letters above the bars represent significant differences.
![Figure 2. S. aureus growth assessed by the BactiterGlo test. Bacterial viability is proportional to relative light units (RLUs). Antibiotics were used as controls, amikacin (AMK) [30 μg/ml], cefallotin (CF) [30 μg/ml], and cefuroxime (CXM) [30 μg/ml]. Bacteria were incubated for 24 hours at 37°C after treatments and evaluated. Different letters above the bars represent significant differences.](/cms/asset/a1deca93-4b9b-4d43-b17c-7cebe5c04476/iaan_a_1754962_f0002_b.gif)
Table 2. Motility of sperms after AgNPs treatment.
Figure 3. Sperm viability. A) Sperm viability measured by MTT assay. The percentage of sperm viability was determined by MTT assay after AgNPs treatment. B) Sperm viability measured by SQS system after AgNPs treatment. The percentage of sperm viability was determined using the sperm classification software of the SQS equipment after AgNPs treatments. C) Representative microphotographs of sperm according to treatment conditions captured in SQS system. In both experiments, sperms were treated as follows: a) control; b) vehicle control; c) 2 mM AgNPs; d) 4 mM AgNPs, and e) 10 mM AgNPs, followed by incubation for 1 h. No significant differences were observed. N = 8.
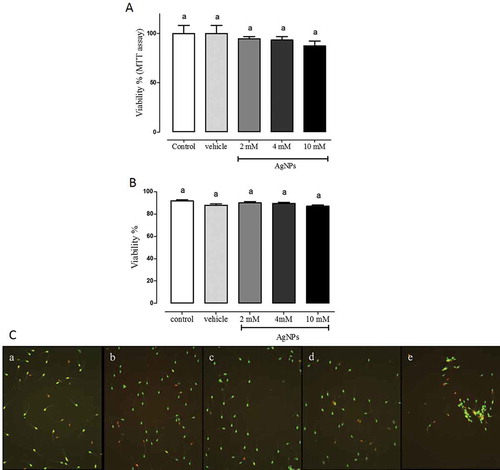
Figure 4. Sperm concentration analysis. Sperm concentration was determined using the sperm classification software of the SQS equipment. Sperm was treated according to these experimental groups: control, vehicle, 2, 4 or 10 mM followed by incubation for 1 h. Different letters above the bars represent significant differences. N = 8.
Figure 5. Sperm morphology. The percentage of Aa) proximal drops, Bb) distal drops and Cc) whip tails was determined after 1 hour of treatment with AgNP at the following concentrations: control, vehicle, 2, 4 or 10 mM. Representative photographs were included. Different letters above the bars represent significant differences. N = 8.
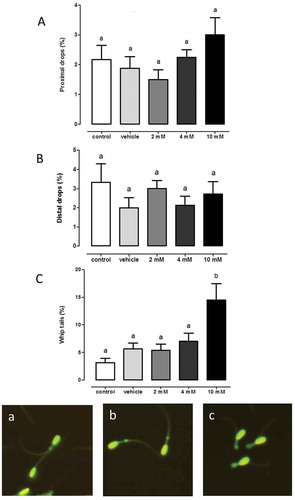
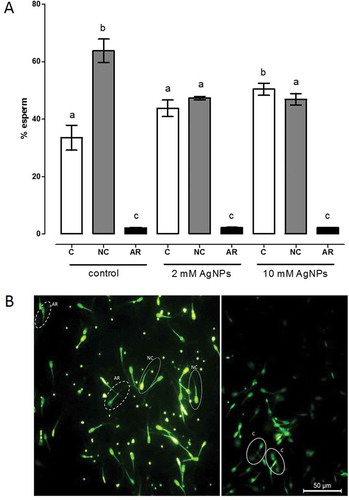
Figure 6. Calcium mobilization patterns through CTC assay. CTC assay of sperm samples exposed to different AgNP concentrations: control, 2 mM or 10 mM. Fluorescence patterns were analyzed under fluorescence confocal microscopy. Groups were classified as: capacitation (C), non-capacitation (NC) and acrosome reaction (AR). Different letters above bars represent significant differences with respect to the control. B) Representative photographs of CTC assay, Confocal Microscopy.