Figures & data
Table 1. Demographic data and semen analysis parameters of groups.
Table 2. Patient counts and percentages due to FSH quartiles and sperm concentrations.
Table 3. Patient counts and percentages due to TT/FSH quartiles and sperm concentrations.
Table 4. Patient counts and percentage due to FSH quartiles and total sperm counts.
Table 5. Patient counts and percentage due to TT/FSH quartiles and total sperm counts.
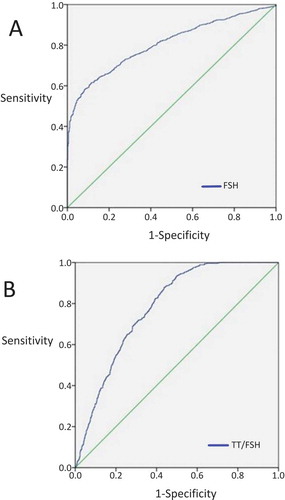
Figure 1. ROC curves; the relationship between sperm concentration and FSH (A) and TT/FSH (B). State variable was sperm concentration in the both curves. When FSH’s cutoff value was 5.18 IU/L, sensitivity 58.5% and specificity was 72.4% (A). When TT/FSH’s cutoff value was 91.66, sensitivity 64.5% and specificity was 61.4% (B).
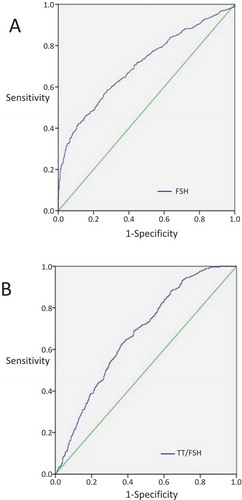
Table 6. Patient counts and percentages due to FSH quartiles and sperm concentrations in the whole study population.
Table 7. Patient counts and percentages due to TT/FSH quartiles and sperm concentrations in the whole study population.
Figure 2. ROC curves; the relationship between patients with normal/abnormal sperm count and FSH (A) and TT/FSH (B). State variable was normal/abnormal sperm count in the both curves. When FSH’s cutoff value was 7.085 IU/L, sensitivity 61.5% and specificity was 88.4% (A). When TT/FSH’s cutoff value was 51.1, sensitivity 87.9% and specificity was 56.2% (B).