
Figures & data
Figure 1. Effects of maternal tobacco smoke and/or ALA treatment on pubertal maturation in female offspring. (A) Cumulative percentage of female rats showing vaginal opening according to age. In the tobacco-smoke group, significantly advanced vaginal opening compared to control female rats (p < 0.05). However, there was no significant difference in ALA or TS + ALA groups compared to the control group. (B) Pubertal weights of female offspring. There is a significant increase in pubertal weight belonging to the ALA group compared to control, TS and TS+ALA groups. There is no significant difference between TS, TS + ALA and control groups. Each experimental group consisted of 7 rats. Data are given as mean ± SD. * p < 0.001 (one-way ANOVA and post hoc Tukey test). VO: Vaginal opening, ALA: Alfa lipoic acid, TS: Tobacco smoke.
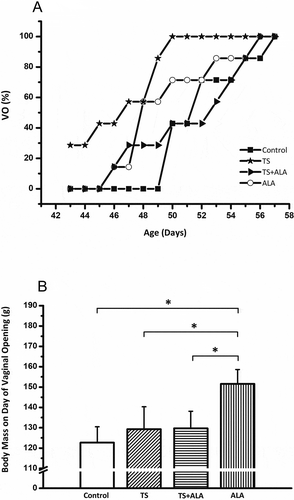
Table 1. Effects of TS and/or ALA on estrous cyclicity in female rats
Figure 2. Effects of maternal tobacco smoke and/or ALA treatment on sexual motivation and receptivity in female offspring. (A) Frequency of anogenital investigations. (B) Lordosis quotient (lordoses/mounts x 100). (C) Lordosis quality scores. Each experimental group consisted of 7 rats. Data are given as mean ± SD. * p < 0.001 with control group (one-way ANOVA and post hoc Tukey test). ALA: Alfa lipoic acid, TS: Tobacco smoke.
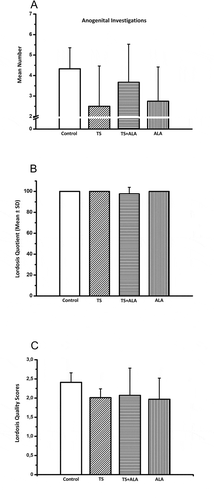
Table 2. Effects of TS and/or ALA on LH, FSH (mlU/ml), TAS and TOS levels (pg/mL) in female rats (n= 7 for each group).
Figure 3. Alteration of Apaf1, Casp 3 and Casp 9 mRNA expression levels in female offspring ovaries of tobacco smoke and/or ALA treatment. Compared to control group; Apaf1, Casp 3 and Casp 9 gene expressions significantly increased in TS, TS+ALA and ALA groups (p < 0.05). Each experimental group consisted of 7 rats. Data are given as mean ± SD. * p < 0.05 (one-way ANOVA and post hoc Tukey test). ALA: Alfa lipoic acid, TS: Tobacco smoke.
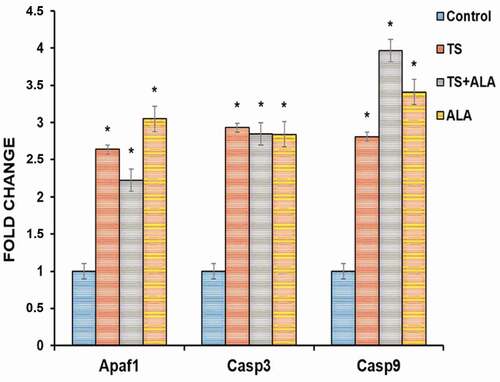
Table 3. The histopathological scores of ovaries
Figure 4. Photomicrographs of the effects of maternal tobacco smoke and/or ALA treatment on offspring ovary tissue: (A,E) control groups; normal ovarian tissue and some follicles; primary follicle (PF), secondary follicle (SF), Graafian follicle (GF), corpus luteum (CL) (B,F) (x20, x10 respectively) TS groups; ovarian tissue showing degenerated follicle (DF), vascular congestion (star), atretic follicle (AF), cystic follicle (CF) vacuolization in granulosa cells (black arrow) (C,G) (x20, x10 respectively) TS+ALA groups; ovarian tissue showing vacuolization in corpus luteum (black arrow), vascular congestion (star), degenerated follicle (DF) (D,H) (x20, x10 respectively) ALA groups; ovarian tissue showing germinal epithelial degeneration (arrowhead), decreased primordial follicle (thick arrow), increased inflammatory cell (triangle) (x20, x10 respectively) (Hematoxylin&Eosin).
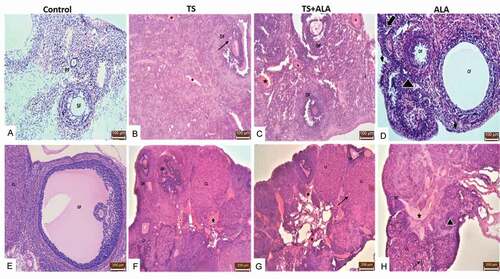
Table 4. Effects of TS and/or ALA on ovarian follicle and corpus luteum count in female rats (n= 7 for each group).
Table 5. Apoptotic index (%), 8-OHdG and 4-HNE staining histoscores in groups
Figure 5. Arrows indicate TUNEL positive cells and 8-OHdG and 4-HNE immunoreactivities of the groups. Compared to control group, TUNEL positive cells, 8-OHdG and 4-HNE immunoreactivities significantly increased in TS, TS+ALA and ALA groups (p < 0.05). The areas stained in red indicated 8-OHdG or 4-HNE immunopositive staining. Also, brown nuclei indicated TUNEL positive cells. All slides were counterstained with hematoxylin (x20). TUNEL: Terminal deoxynucleotidyl transferase-mediated deoxyuridine-biotin nick end labeling, 8-OHdG: 8-hydroxydeoxyguanosine, 4-HNE: 4-Hidroxynonenal.
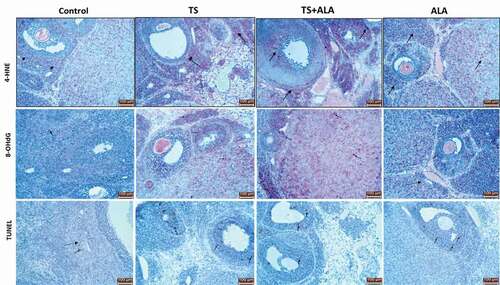
Table 6. Characteristics of the primers used for qPCR analysis