
Figures & data
Figure 1. Determination of the optimal concentrations of ATX. To investigate the optimal concentrations of ATX applied to the ROS model of HTR-8/SVneo cells, (a) the cell viability, (b) the level of DCFH-DA, (c) MDA content, (d) SOD activity, (e) GSH-Px content, and (f) the enzymatic activities of CAT were determined. Compared with control group: ** P < 0.01; *** P < 0.001. Compared with H2O2 group: # P < 0.05; ## P < 0.01; ### P < 0.001. DCFH-DA, 2ʹ,7ʹ-dichlorofluorescein diacetate; MDA, malondialdehyde; GSH-Px, glutathione peroxidase; SOD, superoxide dismutase; CAT, catalase
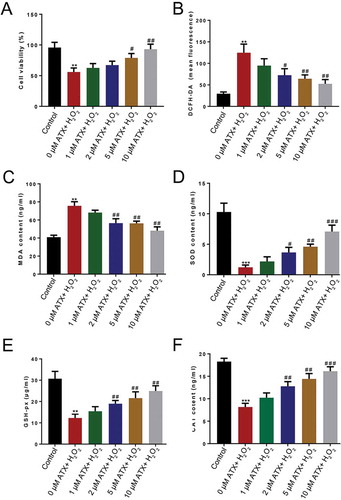
Figure 2. EdU staining of HTR-8/SVneo cells. EdU staining was used to observe cell proliferation (original magnification ×10). The number of EdU-positive cells was recorded. The proliferation rate of H2O2-treated cell is sharply decreased, while ATX could attenuate this effect. Red for Edu; blue for DAPI; dark reddish purple for merge, scale bar is 100 μm
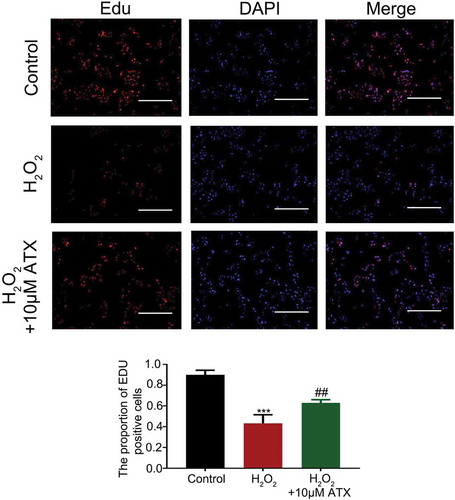
Figure 3. The cell cycle distribution and apoptosis percentage of HTR-8/SVneo cells.(A) HTR-8/SVneo cells were treated differently for 24 h, then analyzed by flow cytometry for cell cycle distribution. Cell cycle distributions after H2O2 and ATX treatment are shown. Blue for cells in 2 n; green for cells in 2 n–4 n; pink for 4 n. (B) The apoptosis percentage of cells was determined by flow cytometry after Annexin V/PI staining. *P < 0.05 and **P < 0.01 were considered statistically significant
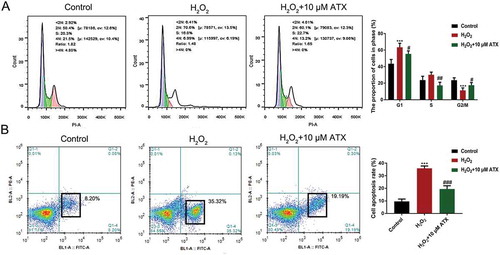
Figure 4. The apoptosis percentage of cells and cell invasion situation. (A) The migrated cells were detected by crystal violet staining and the numbers were counted under microscope (original magnification ×10). (B) The invaded cells were detected by crystal violet staining and the numbers were counted under microscope (original magnification ×10) **P < 0.01; ***P < 0.001. Compared with H2O2 group: #P < 0.05; ##P < 0.01; ###P < 0.001
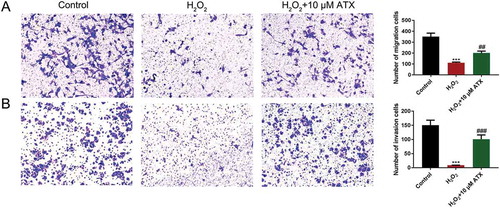
Figure 5. The effect of ATX treatment on HTR-8/SVneo cells function exposed to oxidative stress. (A) Real-time PCR was used to measure the expression of MMP-2, MMP-9, NRF2 and Smad3. (B) Western blot analysis was applied to assess the expression of MMP-2, MMP-9, NRF2, p-Smad3 and Smad3. Compared with control group: **P < 0.01; ***P < 0.001. Compared with H2O2 group: #P < 0.05; ##P < 0.01. MMP-2: matrix metalloproteinase-2; MMP-9: matrix metalloproteinase-9; NRF2: nuclear factor erythroid 2-related factor 2; p-Smad3: phosphor-mothers against decapentaplegic homolog 3; Smad3: mothers against decapentaplegic homolog 3
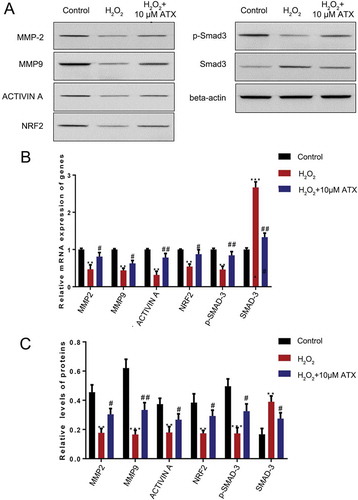
Table 1. Oligonucleotide primers used in real-time PCR
Supplemental Material
Download Zip (5.7 MB)Data availability statement
All data generated or analyzed during this study are included in this published article.