1,637
Views
10
CrossRef citations to date
0
Altmetric
Research Communication

Sperm performance in oligoasthenoteratozoospermic patients is induced by a nutraceuticals mix, containing mainly myo-inositol

, &
Pages 50-63 | Received 18 Feb 2020, Accepted 06 Sep 2020, Published online: 23 Oct 2020

Figures & data

Figure 1. Effects of nutraceuticals mix and MI on motility (A) in vitro (B) in vivo. Motility is expressed as percentage in healthy volunteer’s donors (H), OAT untreated patients (A), sperm from OAT patients treated in vitro with a concentrated solution of MI (B) and OAT patients treated in vivo with a nutraceuticals mix, containing mainly MI (C). PR = progressive motility, NP = non-progressive motility, IM = immobile sperm). The columns represent the mean ± SD. Variables before and after treatment analyzed with Student’s paired t-test. p-value: * ≤ 0.05; ** < 0.01; *** < 0.001. One-way ANOVA between groups. p-value: § ≤ 0.05; §§ < 0.01; §§§ < 0.001.
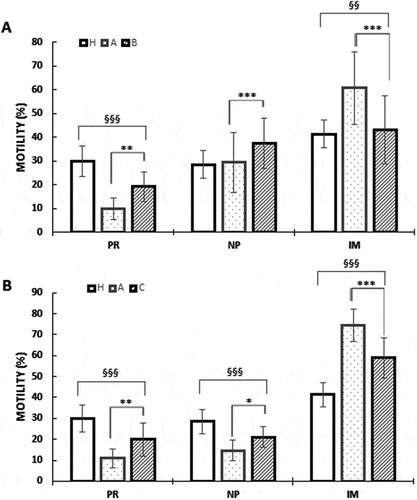
Figure 1. Effects of nutraceuticals mix and MI on motility (A) in vitro (B) in vivo. Motility is expressed as percentage in healthy volunteer’s donors (H), OAT untreated patients (A), sperm from OAT patients treated in vitro with a concentrated solution of MI (B) and OAT patients treated in vivo with a nutraceuticals mix, containing mainly MI (C). PR = progressive motility, NP = non-progressive motility, IM = immobile sperm). The columns represent the mean ± SD. Variables before and after treatment analyzed with Student’s paired t-test. p-value: * ≤ 0.05; ** < 0.01; *** < 0.001. One-way ANOVA between groups. p-value: § ≤ 0.05; §§ < 0.01; §§§ < 0.001.

Figure 2. Nutraceuticals mix and MI improved sperm viability (A) in vitro (B) in vivo. Viability expressed as percentage in healthy volunteer’s donors (H), OAT untreated patients (A), sperm from OAT patients treated in vitro with a concentrated solution of MI (B) and OAT patients treated in vivo with a nutraceuticals mix, containing mainly MI (C).The results are presented as mean ± SD. Variables before and after treatment analyzed with Student’s paired -test. p-value: * ≤ 0.05; ** < 0.01. One-way ANOVA between groups. p-value: §§ < 0.01; §§§ < 0.001
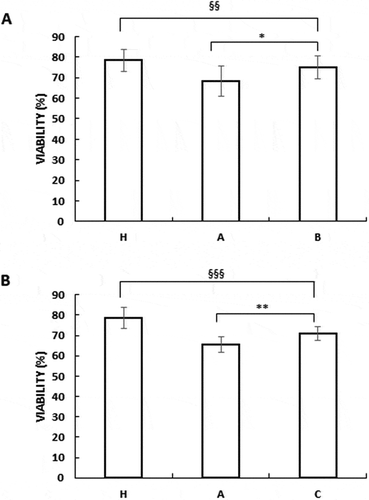
Figure 2. Nutraceuticals mix and MI improved sperm viability (A) in vitro (B) in vivo. Viability expressed as percentage in healthy volunteer’s donors (H), OAT untreated patients (A), sperm from OAT patients treated in vitro with a concentrated solution of MI (B) and OAT patients treated in vivo with a nutraceuticals mix, containing mainly MI (C).The results are presented as mean ± SD. Variables before and after treatment analyzed with Student’s paired -test. p-value: * ≤ 0.05; ** < 0.01. One-way ANOVA between groups. p-value: §§ < 0.01; §§§ < 0.001

Figure 3. Nutraceuticals mix and MI induced Bcl2 phosphorylation. Panel A) 70 μg of sperm protein lysates were used for western blot analysis of Bcl2 phosphorylation. Healthy volunteer’s donors were used as positive control (H). A = OAT untreated patients, B = sperm from OAT patients treated in vitro with MI; C = OAT patients treated in vivo with the supplement mentioned above. For each group three different pooled samples were used. β-actin was used as loading control. Panel B) Densitometric evaluation of the bands
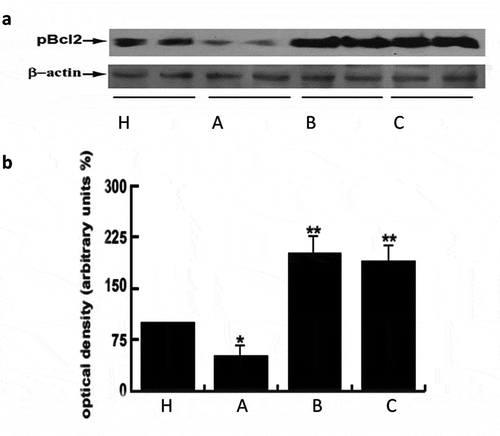
Figure 3. Nutraceuticals mix and MI induced Bcl2 phosphorylation. Panel A) 70 μg of sperm protein lysates were used for western blot analysis of Bcl2 phosphorylation. Healthy volunteer’s donors were used as positive control (H). A = OAT untreated patients, B = sperm from OAT patients treated in vitro with MI; C = OAT patients treated in vivo with the supplement mentioned above. For each group three different pooled samples were used. β-actin was used as loading control. Panel B) Densitometric evaluation of the bands

Figure 4. Effects of nutraceuticals mix and MI on capacitation. Spermatozoa from healthy volunteer’s donors were used as positive control (H). A = OAT untreated patients, B = sperm from OAT patients treated in vitro with MI; C = OAT patients treated in vivo with a nutraceuticals mix, containing mainly MI. The results are presented as mean ± SD. Variables before and after treatment analyzed with Student’s paired t-test. p-value: * ≤ 0.05. One-way ANOVA between groups. p-value: § p ≤ 0.05; §§§ < 0.001.
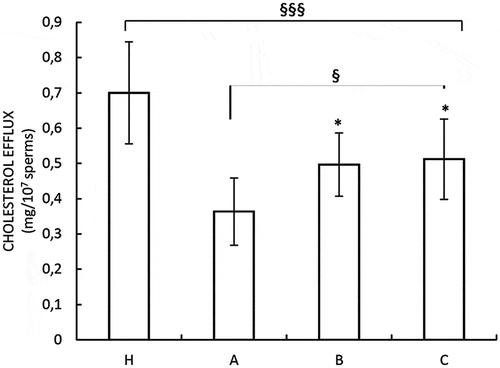
Figure 4. Effects of nutraceuticals mix and MI on capacitation. Spermatozoa from healthy volunteer’s donors were used as positive control (H). A = OAT untreated patients, B = sperm from OAT patients treated in vitro with MI; C = OAT patients treated in vivo with a nutraceuticals mix, containing mainly MI. The results are presented as mean ± SD. Variables before and after treatment analyzed with Student’s paired t-test. p-value: * ≤ 0.05. One-way ANOVA between groups. p-value: § p ≤ 0.05; §§§ < 0.001.

Figure 5. Nutraceuticals mix and MI influenced glucose metabolism through the PPP. H = sperm from healthy volunteer’s donors; HM = sperm from normospermic patients treated in vitro with MI; A = OAT untreated patients; B = sperm from OAT patients treated in vitro with MI; C = OAT patients treated orally with a nutraceutical mix, containing prevalently MI. G6PDH activity has been performed as described in Materials and Methods. Data are expressed in nmol min-1/106 spermatozoa. The results are presented as mean ± SD. Variables before and after treatment analyzed with Student’s paired t-test. p-value: *<0.02; ** ≤ 0.001; *** < 0.0001. One-way ANOVA between groups. p-value: §§§ <0.001.
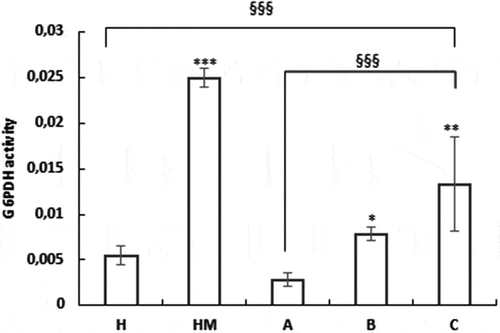
Figure 5. Nutraceuticals mix and MI influenced glucose metabolism through the PPP. H = sperm from healthy volunteer’s donors; HM = sperm from normospermic patients treated in vitro with MI; A = OAT untreated patients; B = sperm from OAT patients treated in vitro with MI; C = OAT patients treated orally with a nutraceutical mix, containing prevalently MI. G6PDH activity has been performed as described in Materials and Methods. Data are expressed in nmol min-1/106 spermatozoa. The results are presented as mean ± SD. Variables before and after treatment analyzed with Student’s paired t-test. p-value: *<0.02; ** ≤ 0.001; *** < 0.0001. One-way ANOVA between groups. p-value: §§§ <0.001.

Figure 6. Nutraceuticals mix and MI modulated lipid metabolism in human sperm. Assays of triglycerides content (A) and lipase activity (B) were performed as described in the Materials and Methods. The results are presented as mean ± SD. Variables before and after treatment analyzed with Student’s paired t-test. p-value: * ≤ 0.05; *** < 0.0001. One-way ANOVA between groups. p-value: §§ < 0.01; §§§ < 0.001.
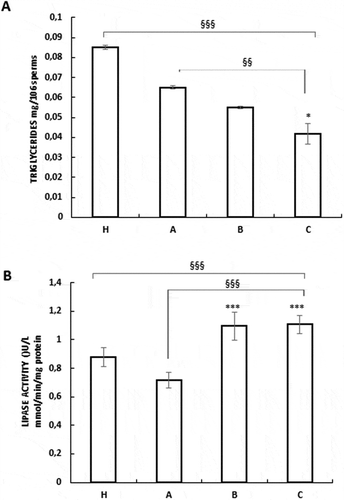
Figure 6. Nutraceuticals mix and MI modulated lipid metabolism in human sperm. Assays of triglycerides content (A) and lipase activity (B) were performed as described in the Materials and Methods. The results are presented as mean ± SD. Variables before and after treatment analyzed with Student’s paired t-test. p-value: * ≤ 0.05; *** < 0.0001. One-way ANOVA between groups. p-value: §§ < 0.01; §§§ < 0.001.

Reprints and Corporate Permissions

Please note: Selecting permissions does not provide access to the full text of the article, please see our help page How do I view content?

To request a reprint or corporate permissions for this article, please click on the relevant link below:

Academic Permissions

Please note: Selecting permissions does not provide access to the full text of the article, please see our help page How do I view content?

Obtain permissions instantly via Rightslink by clicking on the button below:

If you are unable to obtain permissions via Rightslink, please complete and submit this Permissions form. For more information, please visit our Permissions help page.