Figures & data
Table 1. The effect of DEHP on hypospadias induction in male rat fetuses at ED19
Figure 1. Gross SEM images of genital tubercles (GTs) at GD19. In the control group (A & C), a midline groove was clearly observed in external genitalia on ED19. In addition, the penile shaft and glans penis were divided by the coronary sulcus and clearly differentiated. However, in the DEHP group (B&D), the skin folds did not completely cover the corpus cavernosum, which indicates disordered penile foreskin development. PF: preputial fold; UG: urethral groove; ED: embryonic day
Figure 2. Serial histological sections of rat embryonic external genitalia at ED19. Histological analysis of embryonic external genitalia at ED19 by H&E staining. The orientation is from the distal end (left) to the proximal aspect of the GT (right). Black arrow, urethral plate; red arrow, tubular urethra. Notably, the GT of a male rat treated with 750 mg/kg/d DEHP (hypospadias group) showed delays in preputial development and abnormal closure of the urethral seam (B), which differed significantly from the findings in a control male rat (A). (original magnification, ×40)
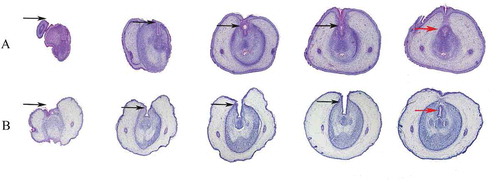
Figure 3. Immunoreactivity (x400) and western blotting analysis of male GTs in the control and DEHP groups. Image of anti-c-Fos antibody staining (brown) indicating c-Fos expression in the urethral epithelium of the male GT, especially in the urethra plate region at ED19 (A). c-Fos staining was stronger in the DEHP group than in the control group. Western blot analysis showed a significant difference in c-fos expression in the GT between the control and DEHP groups (p < 0.05)
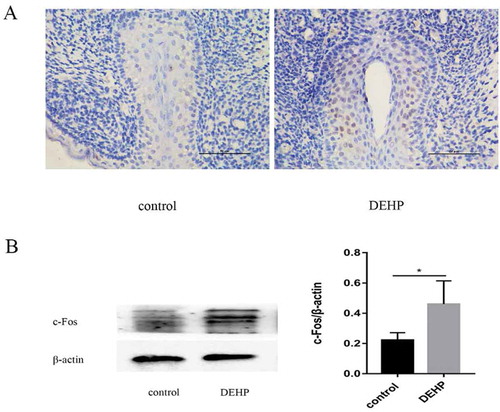
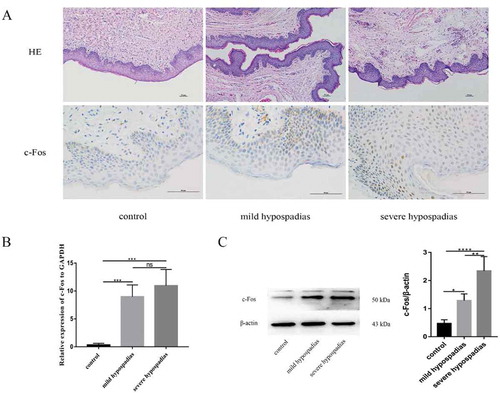
Figure 4. H&E staining (x100), immunoreactivity (x400), real-time PCR (RT-PCR) and western blot analysis of c-Fos in hypospadiac and control tissues. c-Fos expression was observed in both dermal and epidermal cells in human preputial genital skin. In patients with mild or severe hypospadias, the staining was mostly nuclear (A). c-Fos mRNA expression was significantly higher in subjects with hypospadias than in controls (p < 0.01, p < 0.01). However, no such difference was found between subjects with mild and severe hypospadias (B). c-Fos protein levels were significantly different between the control and hypospadias groups (p < 0.05, p < 0.001) and between the mild hypospadias group and the severe group (p < 0.01), suggesting a severity-dependent increase (C)