
Figures & data
Figure 1. Overview of Workflow. The study designs start with Identification of DEGs by Gene Expression analysis, and finding DEGs enriched pathways using Go annotations and creating of PPI network to identify the major hubs and bottleneck proteins from PPI, followed by identification UL or ULMS associated hubs and bottle neck DEGs. Finally, validation and identification target genes associated with UL and ULMS using TCGA and open target web validation tools
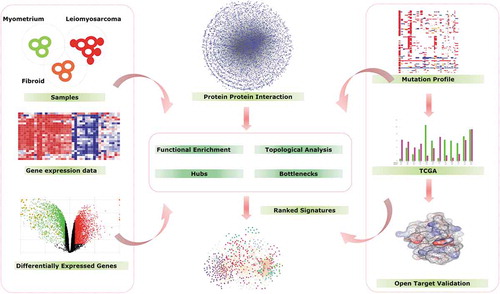
Figure 2. Differentially expressed genes in UL, ULMS, and Myo. (A) Comparison of Up and Down regulated DEGs of Myo vs. UL, Myo vs. ULMS, and UL vs. ULMS. The Volcano plot represented the significant (red, p ≤ 0.05), non-significant (black, p ≥ 0.05), and significant differentially expressed genes (green, −2.0 ≥ FC ≥ + 2.00) of (B) Myo vs. UL. (C) Myo vs. ULMS; and (D) UL vs. ULMS
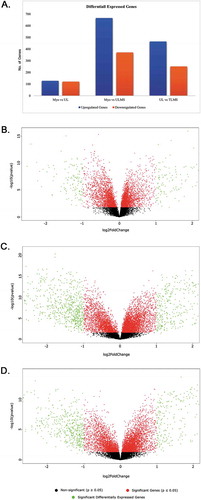
Table 1. The top 5 highly significant DEGs common across three comparison sets
Figure 3. GO-Annotation analysis and shared pathways in UL, Myo, and ULMS. (A)Gene interaction network of shared pathways in Myo, UL, and ULMS, colored ciricles represent the group biological process involved by the DEGs. (B) Venn illustration generated using venny tool Venny (http://bioinfogp.cnb.csic.es/tools/venny/index.html) demonstrating the shared and uniquely enriched pathways in ‘Myo vs. ULMS’, ‘Myo vs. UL’, and ‘UL vs. ULMS’
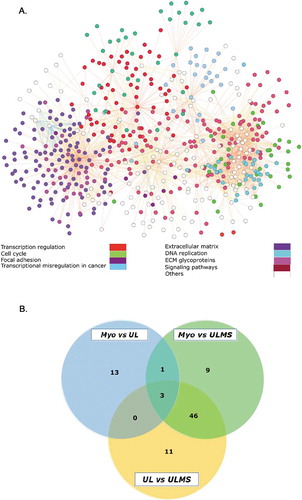
Figure 4. Expression pattern of PPI Hubs and Bottelneck. Heatmap graphs represents the normalized expressed (A) 12 genes in ‘Myovs. UL’ group; (B) 32 genes in ‘ULvs.ULMS’; (C). 49 genes in ‘Myo vs. ULMS’; group. Theline graphs illustrate the number of genes and expression fold changes of hubs (red) and bottlenecks (green) in (D).Myo vs. UL; (E) line graphs Myo vs. ULMS; and (F) line graphsUL vs. ULMS.
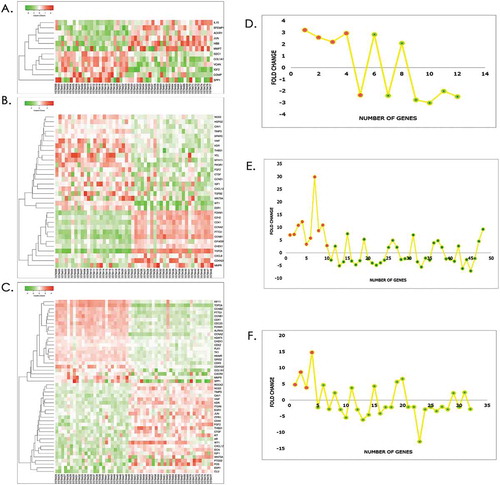
Table 2. List of top four Hub and Bottleneck Genes of Myo vs. UL vs. ULMS
Figure 5. The Cancer Genome Atlas (TCGA) analysis on filtered genes. (A) Percentage of overrepresented 49 hubs and botttel neck genes in UL and ULMS, the hubs and bottlenecks represented by red and blue bars, respectively. The pink crab sign represents Cancer Gene Census in the list. (B) Heatmap and box whisker represents the expression of 12 genes in Myo, UL, and ULMS patient compared to normal
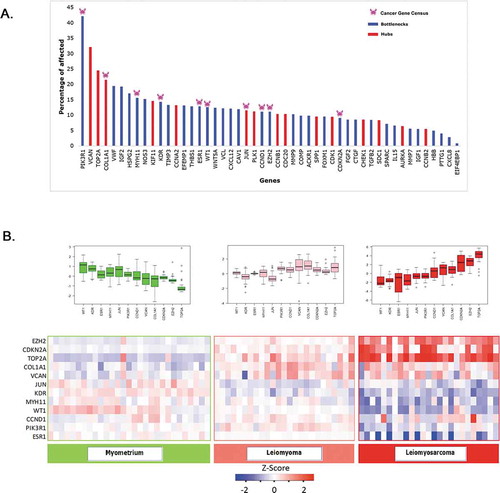
Table 3. The overlapping hub and bottleneck genes from different dataset comparisons and CGC database
Table 4. Open target disease association, tractability, and known drugs of 12 filtered hub and bottleneck genes