Figures & data
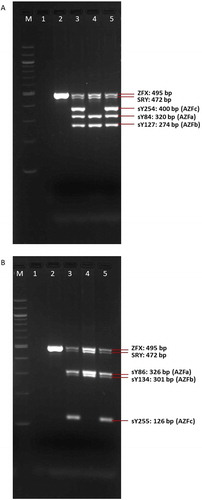
Figure 1. Morphology of testicular germ cells showing a cluster of immature germ cells, Sertoli cells (S), and various lipid inclusions (*) (unstained). Olympus IX71 inverted microscopy (400X)
Figure 2. Morphology of testicular germ cells showing primary spermatocytes (1) and vacuolar degeneration (*) (stained with Giemsa). Olympus BX41 microscopy (1000X)
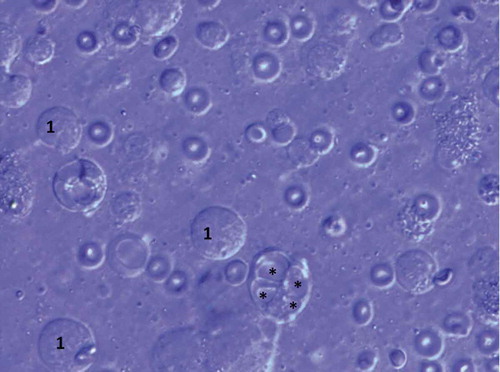
Figure 3. Karyotype of the patient showing 46,X,t(Y;1)(q12;q21) and a pericentric inversion of chromosome 9: inv (9)(p12;q13)
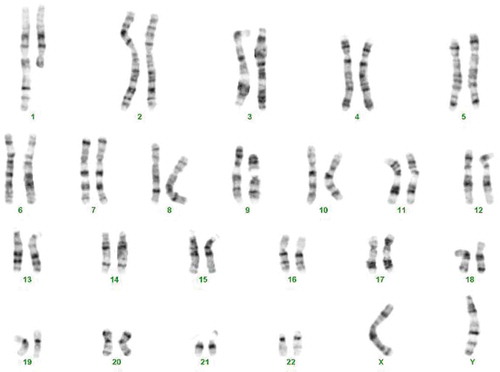
Figure 4. Metaphase FISH showing: der(1) with an intact 1p short arm and a positive signal for the 1p telomere (green); der(Y) with positive signals for the Yp telomere (yellow) and Y centromere (red), followed by the 1q long arm containing the 1q telomere (red); 1 with positive signals for the 1p (green) and 1q telomeres (red); X with positive signals for the Xp telomere (green) and X centromere (green); two chromosomes 18 with positive signals for centromere (aqua). DNA is stained blue with DAPI
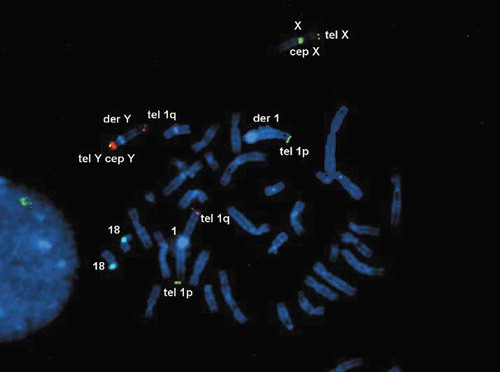
Figure 5. Metaphase FISH showing: der(1) with a positive signal for the 1 centromere (red); 1 with a positive signal for the 1 centromere (red). DNA is stained blue with DAPI
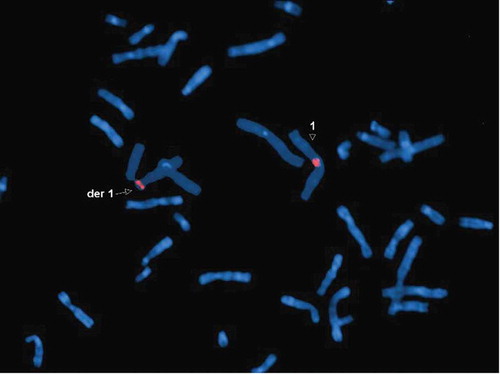
Figure 6. The results of multiplex-PCR-A (A) and multiplex-PCR-B (B) in control subjects and the patient showing intactness of Yp (SRY) and absence of Yq11.2 microdeletions in the AZFa, AZFb, and AZFc regions. M: marker (100 bp); 1: negative control; 2: control female; 3: control fertile male; 4: control infertile male (microdeletions in region AZFc – negative STSs sY254 and sY255); 5: patient