
Figures & data
Figure 1. Examples of fields of cells recovered from 60% fractions following density gradient centrifugation. Samples from N (A), S (B, C and D) and P patients (E, F) were processed. Fields (merged channels) from samples are shown labeled (red channel) for PSMA (A, B, E, F), NKX3.1 (C) and CD24 (D). All except the P samples (E, F) were co-labeled (green channel) for KRT18 and DAPI (blue channel) was included throughout. Panel A shows two PSMA+/KRT18+ features each with two nuclei indicating either individual, closely juxtaposed cells or possibly two bi-nucleate cells surrounded by numerous, much smaller sperm nuclei. Panel B shows a similarly PSMA+/KRT18+ sized cell, with triangular-shaped nucleus and no sign of sperm. Panel C shows an example of an NKX3.1+/KRT18+ cell and panel D shows a low powered field with CD24+/KRT18+ cells (short barbed arrowheads) and CD24−/KRT18+ cells (long barbed arrowheads). The latter may be neutrophils. The panel also shows an example of a CD24+/KRT18−/DAPI− ‘entity’ that may be a cytoplasmic fragment (broken arrow). The remaining panels show examples of PSMA+ cells from P samples with (E/E’) and without (F/F’) signs of sperm. Note the presence of bright PSMA+ vacuoles in the cytoplasm of these cells, more clearly visible in the higher-powered images shown in E’ and F’. Green signals in fields obtained from co-labeled cells were sometimes overwhelmed by the red signals but as can be seen in Supplementary Figure 1 (single channels), were usually present. DAPI-only signals indicated by asterisks may represent cellular fragments remaining after necrosis or apoptosis. The scale bars throughout are 20 µm
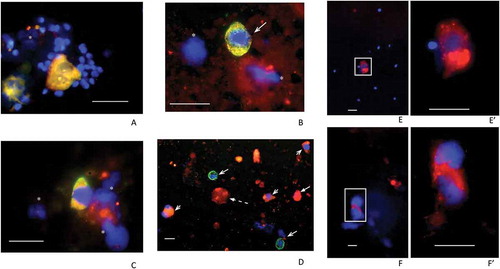
Figure 2. Quantitative RT-PCR of PSMA and CD24 in N and S samples. The chart shows mean normalized Ct values with standard deviation (±SD) for all samples in each group. Relevant comparisons are between RNAs isolated from 60% and pelleted fractions of normal (N) and sterile (S) samples. Lower Ct values arose among all 60% fractions where we expected enrichment of round cells. Significant differences between relevant 60% and pelleted fractions are indicated for A) PSMA (a; p < 0.01) and B) CD24 (b; p < 0.001 and c; p < 0.0001), using one-way ANOVA with Tukey’s post-hoc test
Figure 3. Multi-dimensional scaling (MDS) plot of N (black), S (light gray) and P (gray) samples are shown. The plot separates the samples in two dimensions. A clear differentiation is illustrated between the three sample groups, as indicated by the elliptic lines surrounding the P group (top), the N group (center left) and the S group (bottom right). The clustering suggests significantly differentially expressed small RNAs among the three groups
Table 1. List of differentially expressed small RNAs in N, S and P samples using Fisher’s exact test
Figure 4. Heatmap of top 20 differentially expressed small RNAs in N, S and P samples
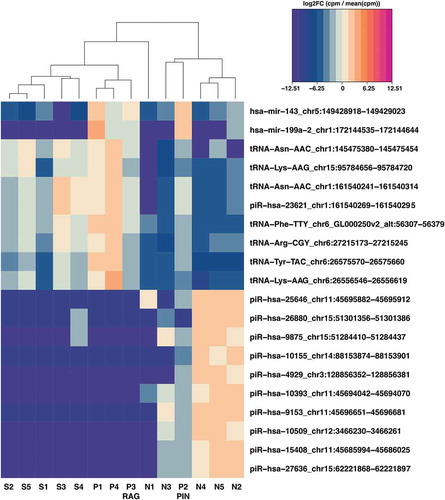
Table 2. Gene ontologies relating to the gene targets of the differentially expressed miRNAs in the N and P groups
Supplemental Material
Download Zip (3.4 MB)Data availability
All the original data used in this publication are available in the Gene Expression Omnibus (GEO Accession number: GSE117968).
Authors’ contributions
Undertook the bulk of the research reported and wrote an early draft of the manuscript: GL; undertook the bioinformatic analysis of the RNA-seq data and contributed to the manuscript accordingly: DI; provided key scientific advice on the study design and contributed to the manuscript accordingly: NM; provided key clinical advice on the study design, provided samples for analysis and contributed to the manuscript accordingly: LM, MM, AM; contributed to the study design and critical reading of the manuscript: RO; designed and undertook methodological aspects of the study, including the target assessment for differentially expressed RNAs, conducted data and ontological analysis, significantly contributed to the manuscript and took responsibility for the final submission: PN; planned and supervised the study, completed the main draft of the manuscript, prepared all additional information including figures and tables and took responsibility for the final submission: DM.