
Figures & data
Figure 1. Study design. Flowchart describing the number of samples in the different groups included in the study. As shown, the study group 3 is a subset of the study group 2
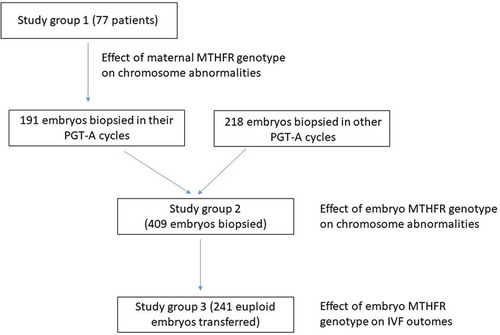
Table 1. Patient characteristics and biochemical and stimulation variables
Table 2. Genotype frequencies compared with 1000 Genomes Project (Phase 3) European population
Table 3. Comparison of aneuploidy and mosaicism rates in embryos (n = 191) according to maternal MTHFR genotype
Table 4. Comparison of aneuploidy and mosaicism rates in embryos (n = 409) according to their MTHFR genotype
Figure 2. C677T and A1298C MTHFR genotype frequencies in the 1000 Genomes Project (Phase 3) European population, female patients and embryos. A) C677T genotypes. B) A1298C genotypes. Fisher’s exact test was used to compare genotype frequencies in patients and embryos with the European population frequencies
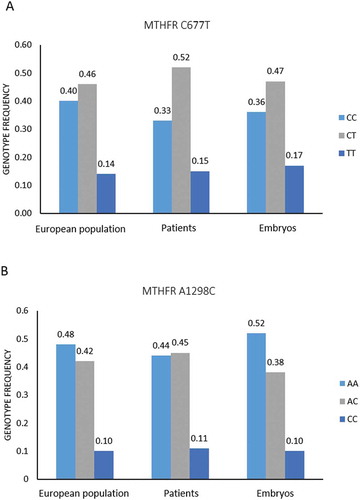
Table 5. IVF outcomes for single euploid embryo transfers according to different C677T/A1298C MTHFR genotypes in transferred embryos (n = 241)