Figures & data
Figure 1. Folic acid deficiency affected the sperm concentration of mice and the histopathology of the testis. (A) plasma folic acid concentration (B) Sperm concentration (C) Sperm motility (D) HE staining of the testes of the control group and the folic acid deficiency group. All experiments were performed n = 6 in replicates. Data were presented as mean ± SEM. ***P < 0.001, ****P < 0.0001
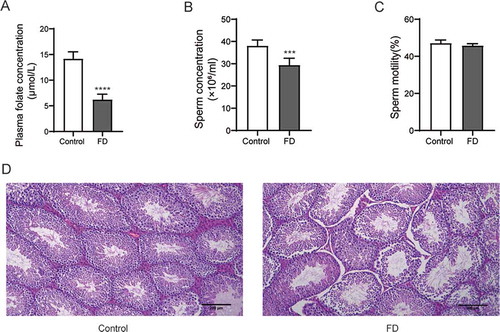
Figure 2. Folic acid deficiency increased apoptosis and genome breakage in testicular tissues. Immunofluorescent images of (A) TUNEL-positive cells (green) and (B) γ-H2AX foci (green) in testicular tissues. The nuclei were stained blue with DAPI. All experiments were performed n = 6 in replicates. Data were presented as mean ± SEM. **P < 0.01, ***P < 0.001
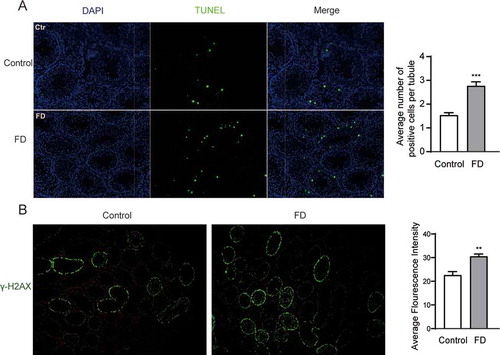
Figure 3. Folic acid deficiency could activate the PERK signaling pathway of ER stress. (A) RT-qPCR analysis of PERK, eIF2a, ATF4 and CHOP in testicular tissues. (B) Western blot analysis of PERK, eIF2a, ATF4 and CHOP in testicular tissues. Control, control group; FD, folic acid-deficient group. All experiments were performed n = 6 in replicates. Data were presented as mean ± SEM; *P < 0.05, **P 0 < .01
Figure 4. Folic acid deficiency inhibited cell viability, and proliferation increased cell apoptosis. (A) CCK-8 assay for detecting the cell viability of GC-2, GC-1, TM3 and TM4. (B) Cell cycle percentage of GC-2 detected via flow cytometry analysis. According to the characteristics of different DNA content of cells in different cell cycle phases, DNA fluorescence dye is used to detect the change of DNA fluorescence intensity in cells and determine the cell cycle where cells are. (C) Expression of apoptotic GC-2 cells determined through flow cytometry. Annexin V-negative/PI-negative (lower left) cells were represented survival cells, Annexin V-positive/PI-negative (lower right) cells were recognized as early apoptotic cells, Annexin V-positive/PI-positive (upper right) cells were considered as late apoptotic cells and necrotic cells. All experiments were performed n = 6 in replicates. Data were presented as mean ± SEM. *P < 0.05, **P < 0.01. Abbreviations: FITC, fluorescein isothiocyanate; PI, propidium iodide
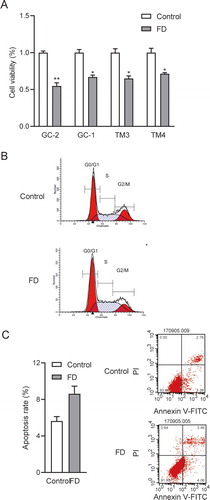
Figure 5. Folic acid deficiency could downregulate the Cav-1 expression and activate PERK in vitro. (A) RT-qPCR analysis of Cav-1, PERK, eIF2a, ATF4 and CHOP in GC-2 cells. (B) Western blot analysis of Cav-1, PERK, eIF2a, p- eIF2a, ATF4 and CHOP in GC-2 cells. All experiments were performed n = 6 in replicates. Data were presented as mean ± SEM, *P < 0.05, **P < 0.01
Figure 6. Cav-1 and PERK–eIF2a–ATF4–CHOP pathways were silenced. (A) Western blot analysis of Cav-1, PERK, eIF2a, ATF4 and CHOP in testicular tissues after Cav-1 silencing. (B) Expression of apoptotic GC-2 cells after Cav-1 silencing determined via flow cytometry. All experiments were performed n = 6 in replicates. Data were presented as mean ± SEM. *P < 0.05, **P < 0.01
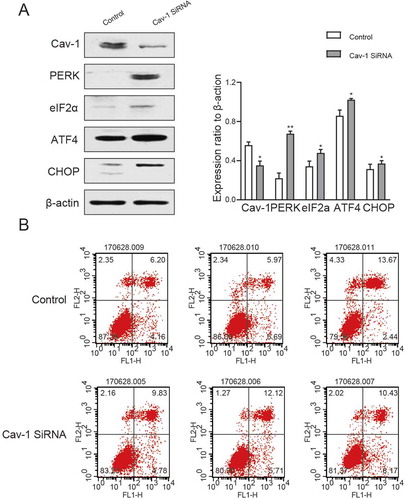
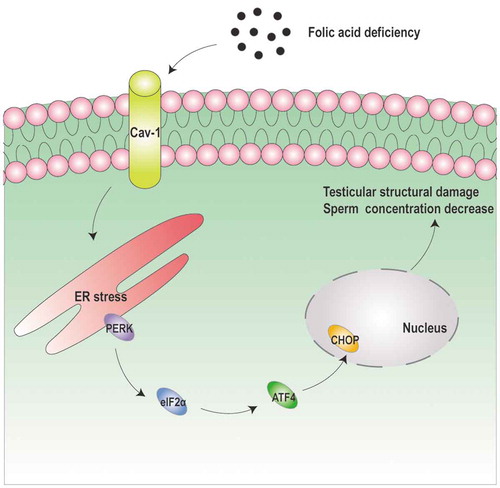
Figure 7. The schematic illustration of folic acid deficiency damages male reproduction. Folic acid deficiency could induce the apoptosis of cells in the male reproductive system in vivo and in vitro. Folic acid deficiency-induced apoptosis was also mediated by downregulating Cav-1 expression, then activating endoplasmic reticulum stress-associated PERK-eIF2α-ATF4-CHOP pathway