
Figures & data
Figure 1. Flow chart of study participant selection
Table 1. Demographics and stimulation characteristics of patients undergoing IVF stimulation cycles (n = 6, 816)
Figure 2. Bar diagram showing the live birth rate (LBR) (A) and miscarriage rate (B) among IVF population without PGT-A (represented in blue) and with PGT-A (represented in orange) across age groups <35 years, 35–37 years, > 37 years. Odds ratios and 95% confidence intervals for the association between live birth and PGT status across all age groups is mentioned on the right box. aOR, adjusted odds ratio; CI, confidence interval
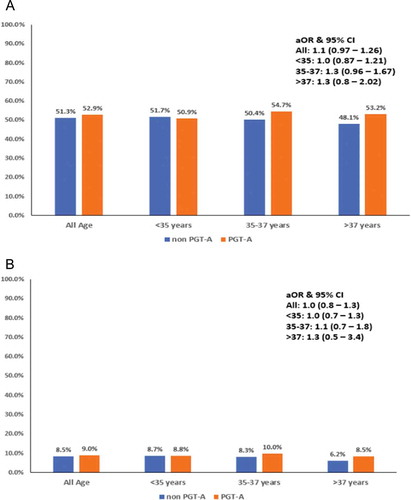
Table 2. Odds ratios and 95% confidence intervals for the association between pregnancy loss, and live birth and PGT-A status in all patients and different age groups