Figures & data
Figure 1. Effect of chronic AVP infusion (50, 100 and 150 ng/h) on (A) systolic blood pressure, (B) urinary protein concentration and (C-F) fetal and placental parameters in pregnant Sprague-Dawley rats. (A) Infusion of 150 ng/h AVP produced a larger increase in systolic blood pressure in pregnant rats than lower doses (50 and 100 ng/h). (B) Rats infused with 150 ng/h AVP showed a marked increase in urine protein levels in comparison to lower doses (50 and 100 ng/h). (C) Individual placental weight, AVP-infusion reduces placental weight. (D) Total number of pups, AVP-infusion does not induce a great change in the total number of pups produced. (E) 150 ng/h AVP infusion induced a significant reduction in total fetal weight in comparison to 50 ng/h. (f) Individual pup weight was significantly reduced pups produced from rats infused with 150 ng/h AVP in comparison to rats infused with 50 ng/h AVP. One-way ANOVA analyses followed by Tukey’s multiple comparison analyses. Data is shown as mean ± SD, *p < 0.05.
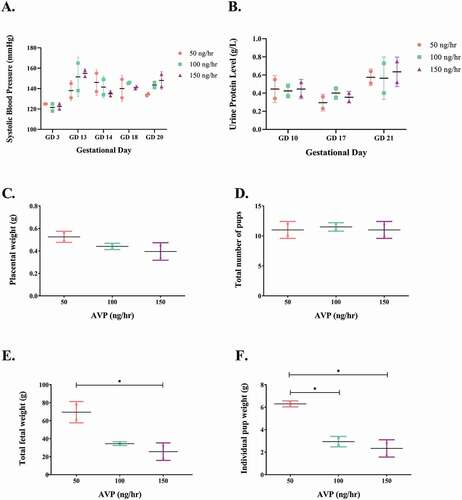
Figure 2. Clinical parameters (A-B) systolic and diastolic blood pressures (mmHg); (C) water intake (ml); (D) urinary output (ml) and (E) urine protein:creatinine ratio levels (mg/dL) across all study groups. Systolic (A) and diastolic (B) blood pressure was significantly increased in AVP-treated groups in comparison to saline groups. (C) Water intake is significantly upregulated in the pregnant groups in comparison to the non-pregnant rat groups. (D) Urine output is significantly reduced in the pregnant AVP-treated group as compared to the pregnant saline group (E) AVP infusion in pregnant rats induced significant elevations in urine protein: creatinine ratio levels in comparison to saline infusion on GD 8 and 14. Kruskal-Wallis and Dunn’s post hoc multiple comparison tests were used to compare the medians between groups. Data is shown as median and interquartile range, *p < 0.05, **p < 0.001. # Data for non-pregnant (NS and NAVP) groups were within normal ranges and are not illustrated.
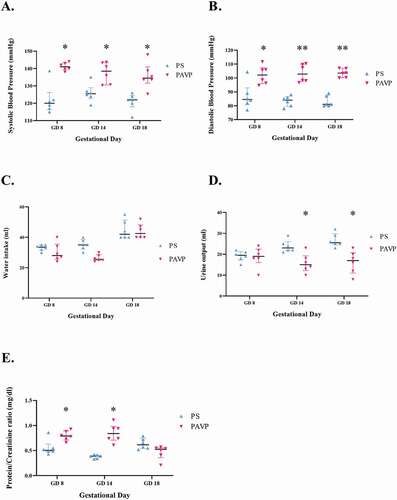
Figure 3. Metabolic parameters (A) weight (g) and (B) liver weight (g); and biochemical parameters (C) alanine aminotransferase (ALT, mmol/L); (D) aspartate aminotransferase (AST, mmol/L); (E) lactic acid dehydrogenase (LDH, mmol/L); (F) total cholesterol (mmol/L); (G) HDL cholesterol (mmol/L); (H) triglycerides (mmol/L) and (I) blood glucose (mmol/L), measured across all study groups on GD 18. (A) Pregnant rat groups demonstrate significant elevations in weight in comparison to the non-pregnant control groups. (B) Liver weight is increased in the PAVP group in comparison to the PS group. (C) ALT concentrations were significantly elevated in the PAVP vs the PS group. (D) AST concentrations are elevated in the PAVP group in comparison to the PS group. (E) LDH levels are significantly increased in the PAVP group in comparison to the PS group. (F) Total cholesterol and (G) HDL cholesterol is significantly reduced in the PAVP group in comparison to the PS group, while (H) Triglyceride levels in the PAVP group are significantly elevated as compared to the PS group. (I) Blood glucose levels are higher in the PAVP group when compared to the PS group on GD 9, conversely the PAVP group is reduced in comparison to the PS group on GD 18. Kruskal-Wallis and Dunn’s post hoc multiple comparison tests were used to compare the medians between groups. Data is shown as median and interquartile range, *p < 0.05, **p < 0.001. # Data for non-pregnant (NS and NAVP) groups were within normal ranges and are not illustrated.
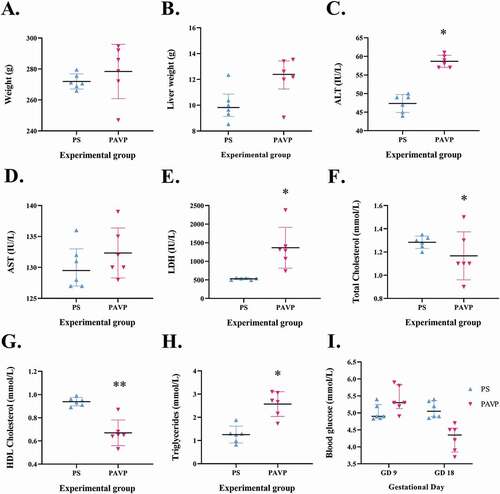
Table 1. Hematological parameters between the non-pregnant AVP and pregnant AVP groups on GD 18.
Table 2. Serum electrolyte levels across experimental groups on GD 18.
Table 3. Fetal and placental parameters.
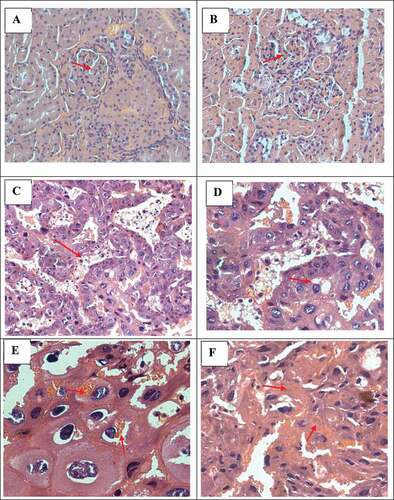
Figure 4. Histopathological examination of tissue sections from pregnant AVP treated rats (H&E stain) displaying (from top left plate clockwise; red arrows): (A-B: Kidney): mild mesangial cell increase, increase in mesangium and reduction in the Bowmans space, 40x magnification; (C-F: Placenta): occasional vacuolation along labyrinth trophoblast cells, 20x magnification; degenerative spongiotrophoblasts, 40x magnification; red blood cell phagocytosis, 40x; and fibrinoids, 40x respectively.