Figures & data
Figure 1. Analysis of ChIP-sequencing data. (A) Analysis of different experimental peak enrichment levels. (B) Boxplot of the density distribution of different experimental reads in the peak annotation area. (C) Gene Ontology (GO) enrichment analysis of peak difference genes. (D) Kyoto Encyclopedia of Genes and Genomes (KEGG) enrichment analysis of peak difference genes. (E) ChIP analysis shows AR bound to the Pebp1 promoter in the Sertoli cells.
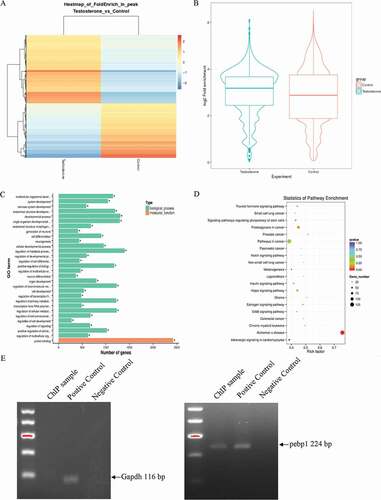
Figure 2. Decreased expression of Pebp1 mRNA and the PEBP1 protein in the testes of ARKO mice. (A) PEBP1 expression in different mouse tissues. (B) The expression of Pebp1 mRNA in the testes of WT and ARKO mice was examined by RT-qPCR. The mean value of WT Pebp1 mRNA was set as 1. Data are expressed as the mean ± SEM (**P < 0.01, n = 4). (C) The expression and localization of PEBP1 in mice testes was detected by immunofluorescence. PBPE1 and the nucleus were labeled as green and blue, respectively (n = 4). In the merge figures, * represents the adluminal compartment of seminiferous tubules, red dotted elliptical shape shows Sertoli cells, yellow dotted rectangle shows Leydig cells.
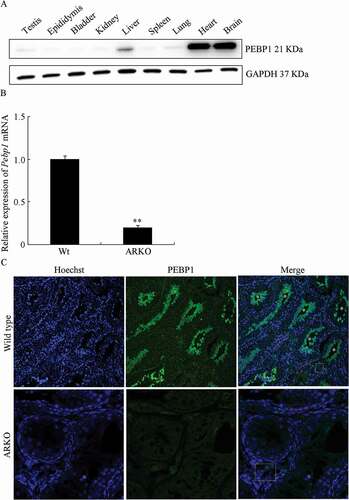
Figure 3. Expression characterization of PEBP1 during testis development. (A) RT-qPCR analysis was used to detect Pebp1 mRNA in developing postnatal mouse testes. The relative expression of Pebp1 at different stages of testis development was compared to 1 week (w). Gapdh was used as an internal control. Data are expressed as the mean± SEM (n = 4). (B) PEBP1 protein expression was detected by Western blot analysis. GAPDH (36 kDa) was used as an internal control.
Figure 4. Immunofluorescence localization of PEBP1 in mouse testes. The nuclei of the cells were labeled with Hoechst 33,342 (blue).
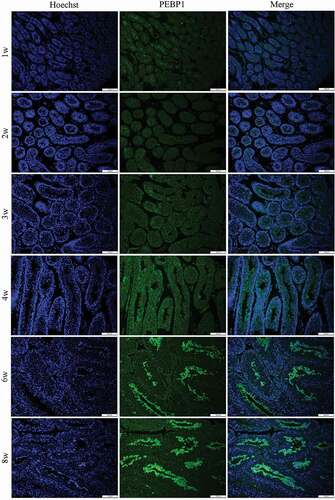
Figure 5. Increased Pebp1 promoter activity by AR and testosterone in TM4 cells. Dual luciferase assay was used to detect the effects of testosterone on Pebp1 promoter activity in TM4 cells. The control was performed with the empty vector. The results are presented as the fold-change of testosterone treatment relative to vehicle treatment. The data are expressed as the mean ± SEM (n = 3). **, P < 0.01.
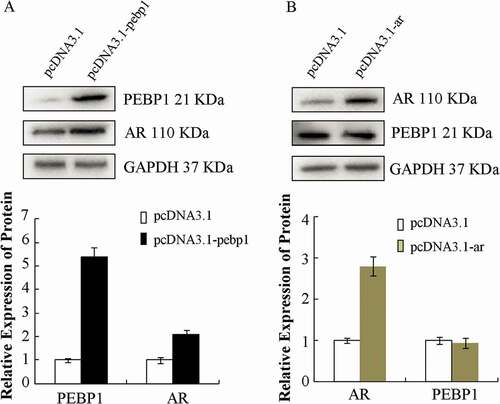
Figure 6. AR was up-regulated by overexpression of PEBP1. Cells were transfected with pcDNA-pebp1 (A) or pcDNA-ar (B), and Western blot analysis was used to detect PEBP1 and AR expression. The data in the bar graph are expressed as the mean ± SEM (n = 3).