Figures & data
Figure 1. Rat testis histological analysis. Control (A–D) and decellularized (E–H) testis under macroscopic view, hematoxylin and eosin and Picrosirius Red staining. (E) Through the macroscopic view, it is possible to observe a color change in the samples, becoming translucent after decellularization. (B,F) Hematoxylin and eosin staining shows the presence of cells in the control tissue and the absent of it in decellularized scaffolds. (H) Picrosirius Red staining under polarized light shows an apparent greater amount of collagen in decellularized testis. Seminiferous tube (ST), decellularized seminiferous tube (dST), and interstice (I); spermatogonia (thick arrow); Sertoli cell (thin arrow); myoid cells (M); slender (in yellow) and thick (in red) collagen fibers (G–H). Scale bar: (A, E) 1 cm; (B) 50 µm; (C,D) and (F, H) 20 µm.
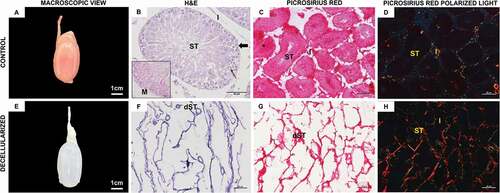
Figure 2. gDNA quantification and DAPI fluorescence. (A) The level of decellularization was quantified with genomic DNA extracted from the control tissue and decellularized testis. DNA quantification revealed a reduction in DNA amount between the control and decellularized rat testis (p = 0.019, Student’s t-test) subjected to decellularization treatment. (B, C) Through DAPI fluorescence, it is possible to observe the absence of cell nuclei in decellularized testis according to the results of DNA quantification. Scale bar: (B, C) 100 µm.
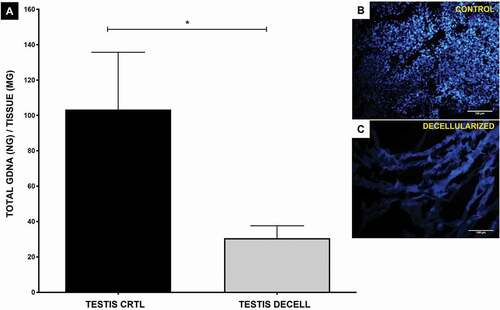
Figure 3. Rat testis immunohistochemistry. (A–D) Control testis samples and decellularized samples ECM (E–H). Both control and decellularized testis showed a positive reaction for collagen I (A, E), collagen III (B, F), fibronectin (C, G), and laminin (D, H), with laminin expression being apparently higher in both control and decellularized testis. From this, it is possible to observe that the components of the ECM were preserved after decellularization (EH). Arrow (positive expression); asterisk (negative control); seminiferous tube (ST); interstice (I); Testicular parenchyma (P). (B) and (D–H) 50 µm; (C) 20 µm.
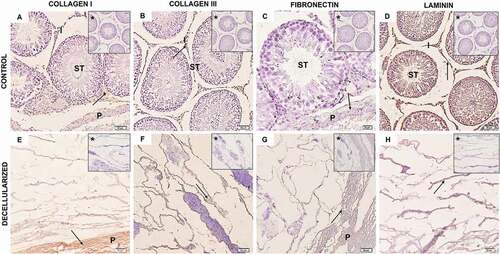
Figure 4. Rat testis SEM. (A, B) The seminiferous tubules and their cells can be seen in the testis of a control rat (yellow arrow). (C, D) It is possible to view the decellularized testis ECM architecture, without cells, and preserved structural proteins, such as collagens fibers (red star). (A, C, G) 30 µm; (B) 300 µm; (D) 1 µm; (E, F) 10 µm.
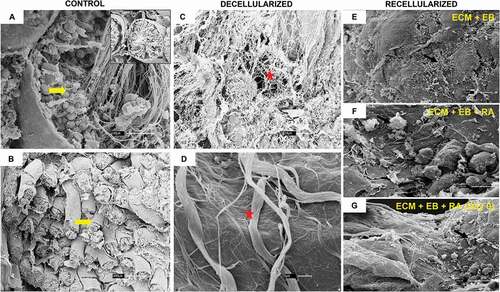
Figure 5. Recellularization Immunofluorescence analysis of control. group. (AI–DIV) Control group: ECM + EB. Embryoid bodies (EB); extracellular matrix (ECM). Red arrow indicates regions of cellular antibody-positive expression, and yellow arrow indicates cellular antibody and matrix antibody overlap. Observe positive expression of ACRV1 (AI–AIV), indicating the differentiation in prostate gland cells; GDNF (BI–BIV), indicating the presence of Sertoli cells and SSCs; HSD17B3 (CI–CIV), indicating the proliferation of Leydig cells or the presence of EBs; TRIM36 (DI–DIV) express the proliferation of prostate cells in testis scaffold. Laminin antibody evidencing the ECM. Scale bar: (AI–DIV) 20 µm.
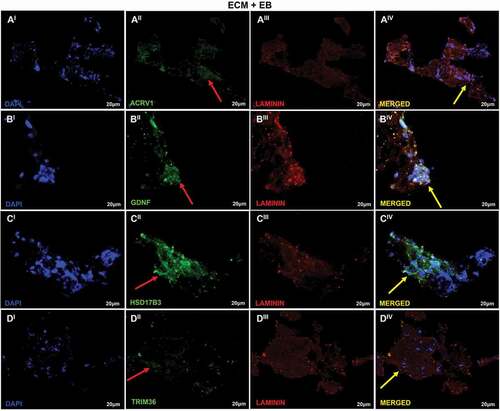
Figure 6. Recellularization Immunofluorescence analysis of T1 group. (AI–DIV) T1: ECM + EB + 0.1 µM RA (added when EBs were formed). Embryoid bodies (EB); extracellular matrix (ECM); retinoic acid (RA). Red arrow indicates regions of cellular antibody-positive expression, and yellow arrow indicates cellular antibody and matrix antibody overlap. In this analysis, the cells show positive expression for the antibodies ACRV1 (AI–AIV), indicating the differentiation in prostate gland cells; GDNF (BI–BIV), indicating the presence of Sertoli cells and SSCs; HSD17B3 (CI–CIV), indicating the proliferation of Leydig cells or the presence of EBs; TRIM36 (DI–DIV) shows the proliferation of prostate cells in testis scaffold. Laminin antibody evidencing the ECM. Scale bar: (AI–DIV) 20 µm.
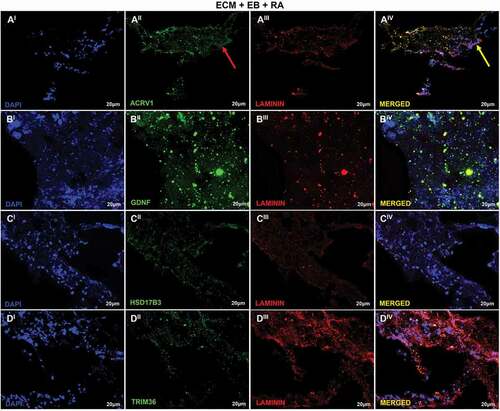
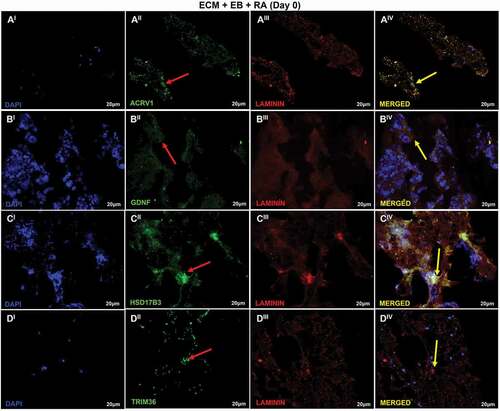
Figure 7. Recellularization Immunofluorescence analysis of T2 group. (AI–DIV) T2: ECM + EB + AR – day 0 (RA added at first day of recellularization assay). Embryoid bodies (EB); extracellular matrix (ECM); retinoic acid (RA). Red arrow indicates regions of cellular antibody-positive expression, and yellow arrow indicates cellular antibody and matrix antibody overlap. Positive expression of ACRV1 (AI–AIV) showing the differentiation in prostate gland cells; GDNF (BI–BIV), with high expression evidencing the presence of Sertoli cells and SSCs; HSD17B3 (CI–CIV), high expression indicating Sertoli cells in embryonic and prepubertal development; TRIM36 (DI–DIV), reasonable expression indicating some proliferation of prostate cells. Laminin antibody evidencing the ECM. Scale bar: (AI–DIV) 20 µm.