
Figures & data
Figure 1. Profiles of regional methylation in contamination set. Regional methylation for each of the four contamination sets, with mean methylation and SD shown for each group (n = 16). The 38 differentially methylated regions from the Illumina 450k DMR pipeline are shown. (A) Beta values of pure sperm samples (post somatic cell lysis) at the DMRs used by the traditional DMR analysis. Note consistent hypomethylation with minimal variability. (B) Beta values of WBC samples (extracted from buffy coat) at DMRs of interest. Note consistent hypermethylation with minimal variability. (C) Beta values of a sample that is half somatic cell by DNA ratio at DMRs of interest, indicated how an extremely contaminated sample would appear using the traditional DMR analysis. (D) Beta values of a sample that is half somatic cell by cell count at DMRs of interest, further illustrating the signature of a contaminated sample.
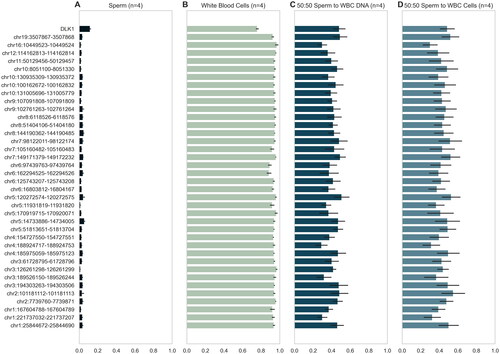
Figure 2. DMR contamination score and DLK1 methylation. (A) The number of contaminated loci, determined by the traditional DMR pipeline, is shown. Samples with somatic-like methylation at 40 regions and DLK >.2 are considered contaminated. (B) A comparison of total contaminated loci in oligozoospermic and normozoospermic samples shows that samples with a low sperm count are more likely to be marked as contaminated than those with a normal sperm count using the DMR analysis. p Value from an independent t-test between the two groups is shown. (C) The mean beta values at the DLK1 locus of the FAZST data set (n = 897) are shown. Traditionally, samples above a beta value of ∼0.2 would be considered contaminated.
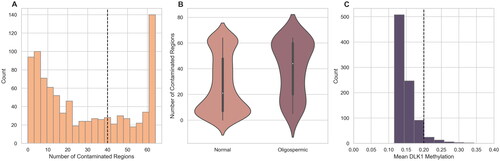
Figure 3. Overlap of samples identified via tested models. A Venn diagram showing the overlap of samples determined to be contaminated with DLK1, the DMR pipeline, and the machine learning (ML) model.
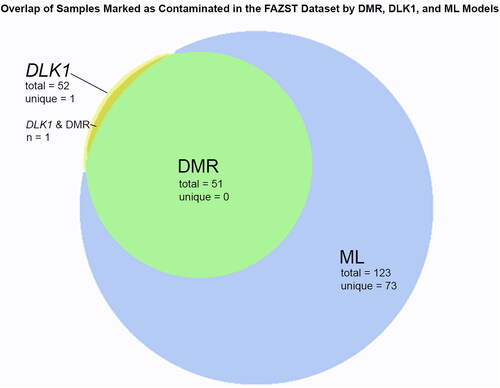
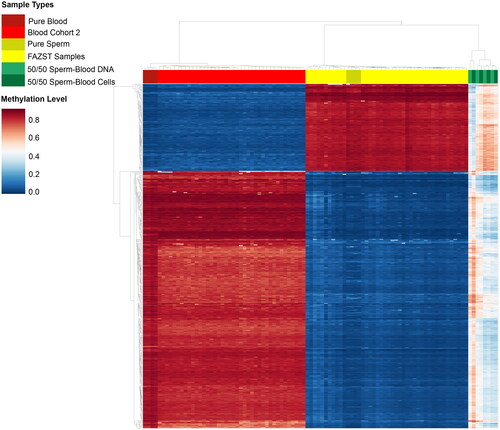
Figure 4. Unsupervised clustering of sperm, blood, and contaminated samples. Heat map showing unsupervised clustering of sperm, blood, and contaminated samples at generated DMRs. For easier comparison, a limited number of samples from the blood (n = 50) and FAZST (n = 50) are shown alongside the testing set (n = 4, n = 4, n = 4, n = 4).
Supplemental Material
Download MS Word (16.4 KB)Supplemental Material
Download MS Word (44.8 KB)Supplemental Material
Download MS Word (16 KB)Data availability statement
The blood cohorts used as controls in this study are available on GEO (GSE152026 and GSE153712). The sperm datasets are available at (doi: 10.1016/j.fertnstert.2015.08.019, doi: 10.1001/jama.2019.18714, and doi: 10.3389/frph.2022.1043904). The contamination set data are available on GEO, accession number GSE246935.