Figures & data
Figure 1 Monthly average wind speed and monthly average daily load of 100 typical residential houses of Saudi Arabia.
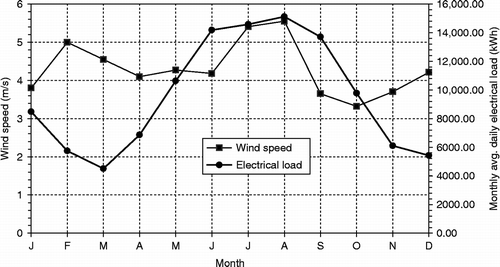
Figure 2 Monthly average wind speed at different hub-heights.
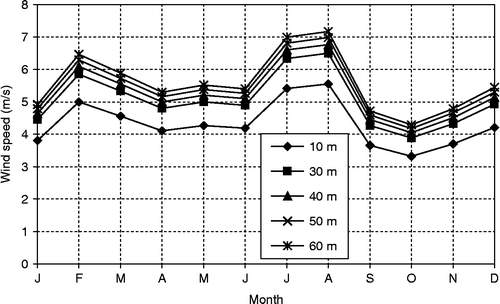
Figure 3 Daily wind-speed data for one complete year (1997).
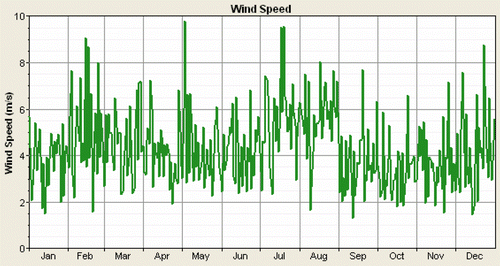
Figure 4 Cumulative frequency distribution of wind speed.
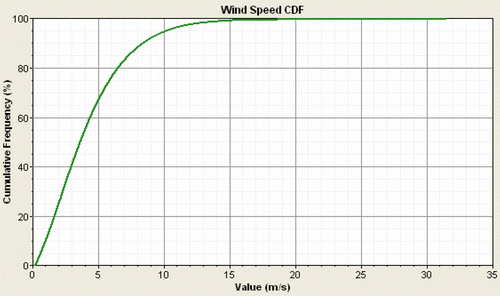
Table 1 Power–wind characteristics of 600 kW CWM.
Table 2 Technical data and study assumptions of diesel units.
Figure 5 Power curve of commercial 600 kW wind machine.
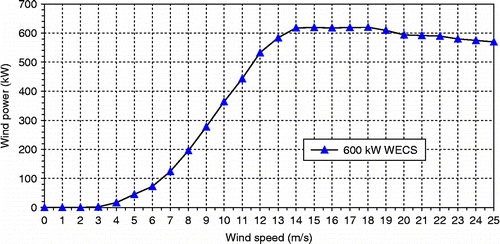
Figure 6 Schematic of hybrid wind–diesel power system.
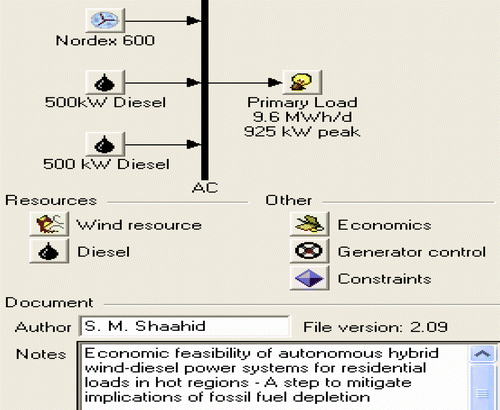
Figure 7 Daily average load (kW) data variations.
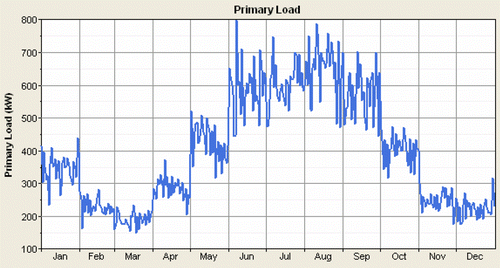
Figure 8 Technical and economic parameters of wind–diesel systems (at 40 m hub-height).
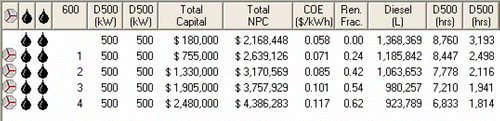
Figure 9 Technical and economic parameters of wind–diesel systems (at 50 m hub-height).
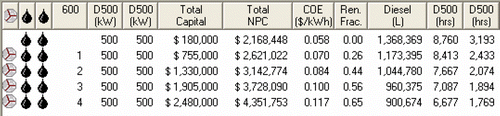
Figure 10 Technical and economic parameters of wind–diesel systems (at 60 m hub-height).
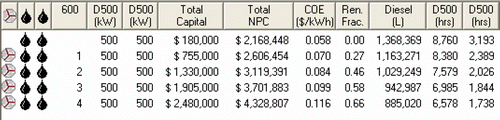
Figure 11 Power generated by a diesel and wind system (50 m hub-height).
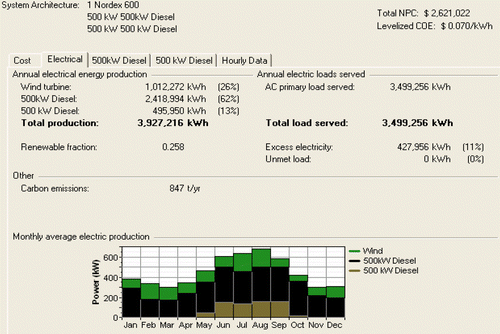
Figure 12 Cost of diesel and wind power system (at 50 m hub-height).
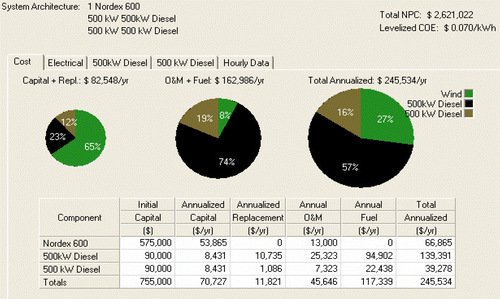
Figure 13 Impact of wind penetration on diesel engine operation time.
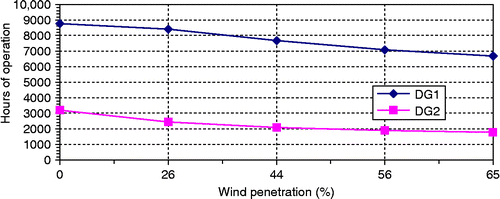
Figure 14 Impact of wind penetration on diesel fuel consumption and carbon emissions (at 50 m hub-height).
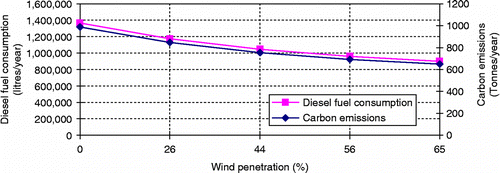
Figure 15 Impact of wind penetration on COE and excess energy generated (at 50 m hub-height).
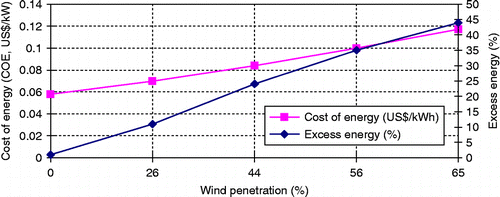
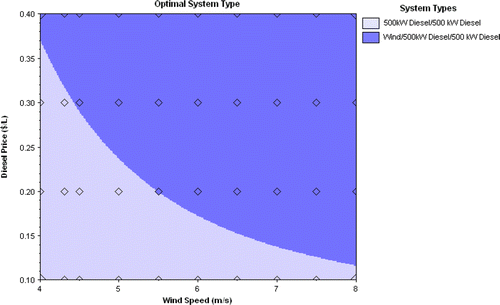
Figure 16 Sensitivity analysis results of hybrid wind–diesel power systems.