
Figures & data
Figure 1. Scheme of the rotating system of the centrifugal concentrator with implied mass and water streams: (1) feed funnel, (2) concentrator bowl, (3) counterflow water chamber and (4) rotating steel chamber connected to the impeller.
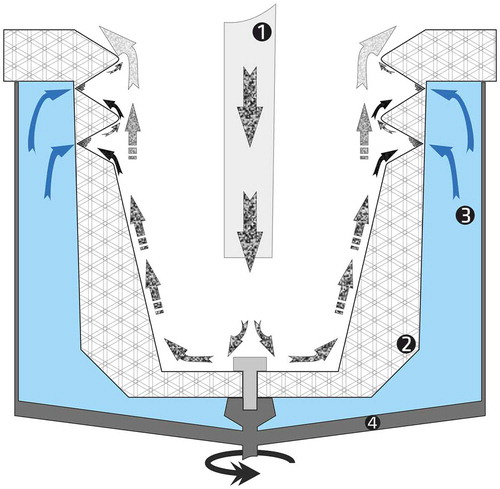
Figure 2. Scheme of the test rig: (1) water tap, (2) nozzle for spreading of tap water, (3) funnel and vibrating chute for proportioning the aggregates, (4) funnel for suspending and feeding of the concentrator bowl, (5) centrifugal concentrator, (6) water tank with wet-pit pump, (7) manometer and (8) settling chamber.
Figure 3. Batch 1 of material B before (left) and after (right) impact by the high speed rotation accelerator; images taken by an optical digital microscope.
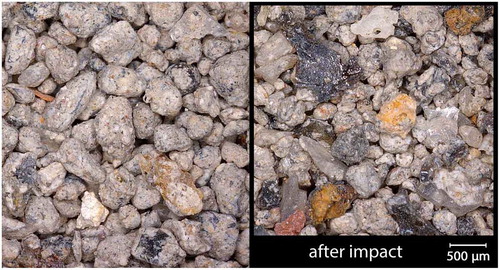
Figure 4. Particle size distributions (density distribution: red-axis; cumulative distribution: black-axis) of material B.
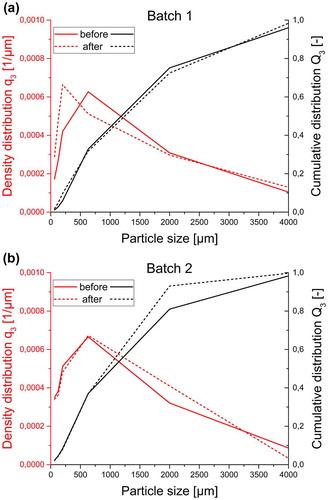
Figure 5. Material C; image taken by an optical digital microscope.
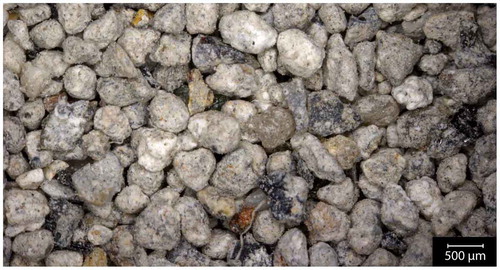
Figure 6. Particle size distributions (density distribution: red-axis; cumulative distribution: grey-axis) of material C.
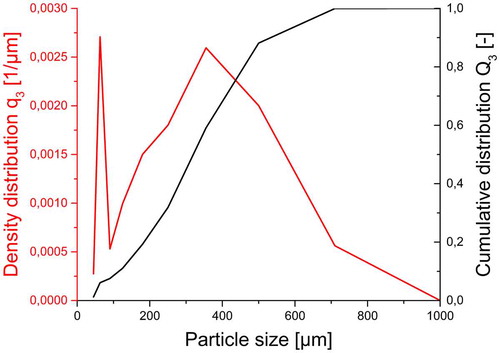
Figure 7. Enrichment factors for material C related to the mass yield (logarithmic scale); each point of the curves refers to a specific rotational speed level (from high to low mass yields: 437, 510, 583, 655 and 729 rpm).
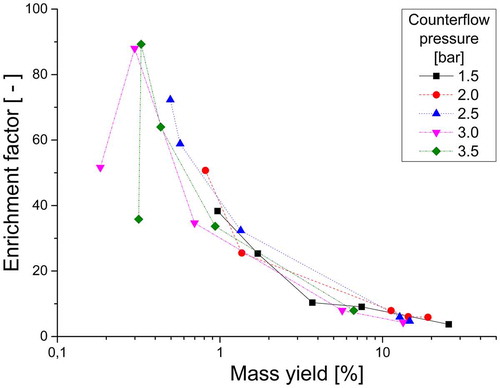
Table 1. Coding for the investigations based on the design of experiments (DOE).
Table 2. Copper contents in the sieve fractions of the material B before and after impact.
Table 3. Copper and lead contents in the sieve fractions of the material C.
Table 4. Mass yields (R M ), and contents, enrichment factors (i) and valuable yields (R V ) for copper in the sieve fractions <250 μm of the Alpha line.
Figure 8. Valuable yields for material C related to the mass yield (logarithmic scale); each point of the curves refers to a specific rotational speed level (from high to low mass yields: 437, 510, 583, 655 and 729 rpm).
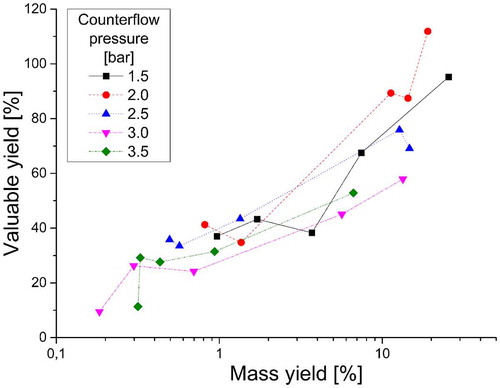
Figure 9. Lead contents in the concentrates of the investigations with material C in relation to the copper contents (black circles – data from investigations displayed in and , red diamonds – data from investigations listed in ).
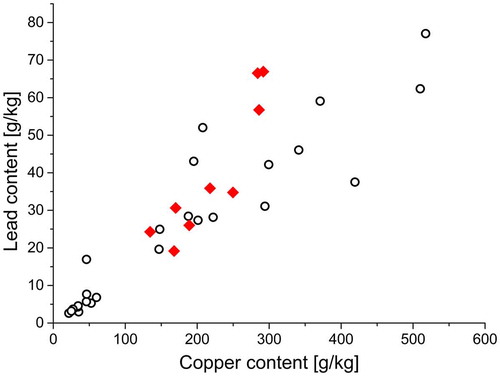
Table 5. Results of the DOE runs with material C: factor levels of the rotational speed and the counterflow pressure; mass yields and density of the concentrate, enrichment factors and valuable yields for copper.
Table 6. Results of the DOE assessment with material C: calculated linear and quadratic effects related to the mass yields (R M ) as well as to the enrichment factors (i) and valuable yields (R V ) for copper and for lead, respectively.