
Figures & data
Figure 1. Particle size distributions for studied materials.
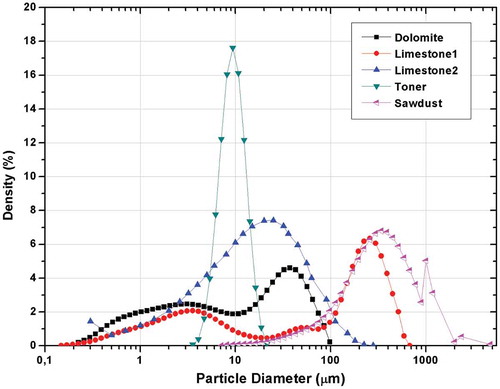
Figure 2. Particle size distributions accumulation for studied materials.
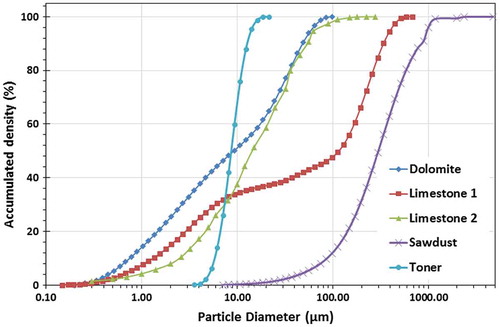
Table 1. Materials properties.
Figure 3. Basic scheme for particles separation–classification process (BS). HE: heat exchanger; PF: powder feeder; CY: cyclone; FI: filter; BL: blower; F: process streams.
and
: control volumes for energy purpose.
Figure 4. Cyclone main dimensions. Tangential input. a: input height; b: input width; Dc: diameter; B: bottom outlet diameter, Ds: top outlet diameter; S: output height; h: cylindrical height; z: conical height, H: total height.
Figure 5. Energy integration scheme (EI). Mix: mixer; SP1: splitter 1; SP2: splitter 2; F: process streams.
and
: control volumes for energy purpose.
Table 2. Mass fractions x(i,j) for BS and EI process streams.
Table 3. Geometric constraints for different cyclones models.
Table 4. Optimal process variables for BS scheme. C2:500 g/m.
Figure 6. Optimal process flows. BS scheme for sawdust particles. Flows [kg/s].
![Figure 6. Optimal process flows. BS scheme for sawdust particles. Flows [kg/s].](/cms/asset/5d34d1d2-9d61-42f4-8359-a052d50842a4/tsue_a_1387185_f0006_b.gif)
Figure 7. Optimal process flows. EI scheme for sawdust particles. Flows [kg/s].
![Figure 7. Optimal process flows. EI scheme for sawdust particles. Flows [kg/s].](/cms/asset/57db6622-5555-473d-b9ed-1829e51abbde/tsue_a_1387185_f0007_b.gif)
Table 5. Energy consumptions for different process schemes and materials.