
Figures & data
Figure 11. Inputs and outputs analysis for final disposal stage.
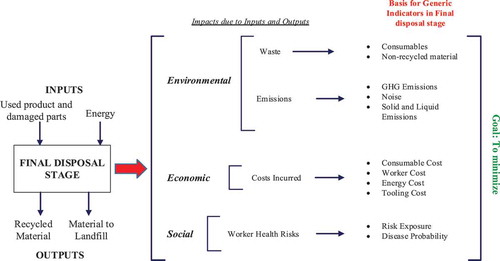
Table 1. Literature review analysis of assessment tools and methods.
Table 2. Sustainable indicators in manufacturing stage.
Table 3. Common social indicators concerning sustainability.
Figure 1. RAISE method stages and outputs.
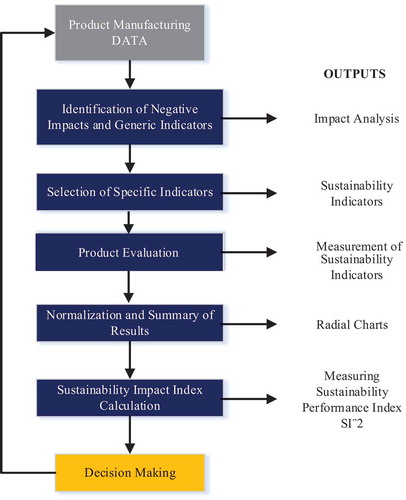
Figure 2. Generic impacts and direct indicators for sustainability in a generic manufacturing process.
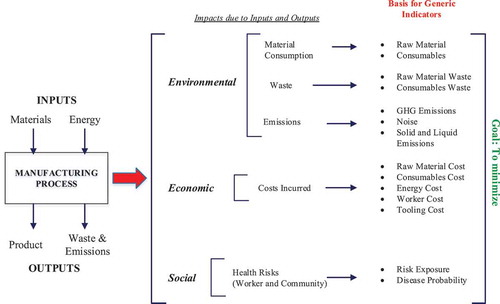
Table 4. Specific indicators for measuring sustainability in manufacturing processes.
Table 5. Social direct indicators: risk exposure.
Figure 3. Area calculation for four vertices polygon.

Figure 4. Guitar capo model: (a) top view; (b) isometric view.
Figure 5. Manufactured guitar capo: (a) guitar capo manufactured in PLA; (b) guitar capo manufactured in ABS.
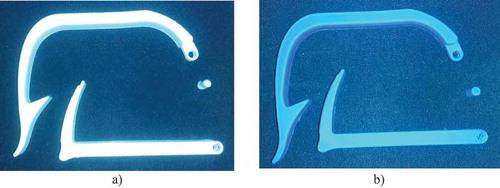
Figure 6. Generic impacts and indicators in the manufacturing of a guitar capo through injection moulding.
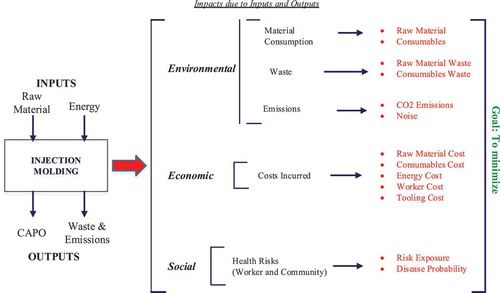
Table 6. Specific indicators and values for guitar capo.
Table 7. Manufacturing scenarios attributes for calculation of specific indicators.
Table 8. Relatives values of specific indicators for product reference and alternatives.
Table 9. Normalised values for reference product and manufacturing scenarios.
Figure 7. Radial chart comparison of reference product and manufacturing scenarios 1 and 2 (linear scale).
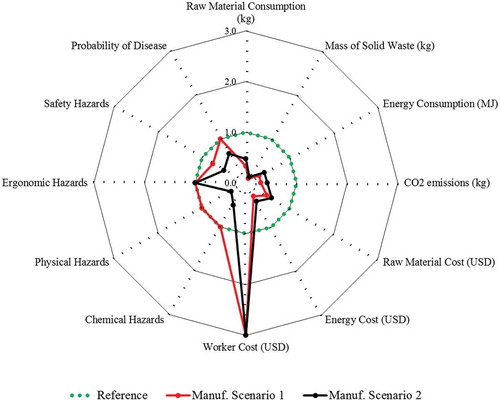
Figure 8. Radial chart comparison between reference product and manufacturing scenario 1 (logarithmic scale).
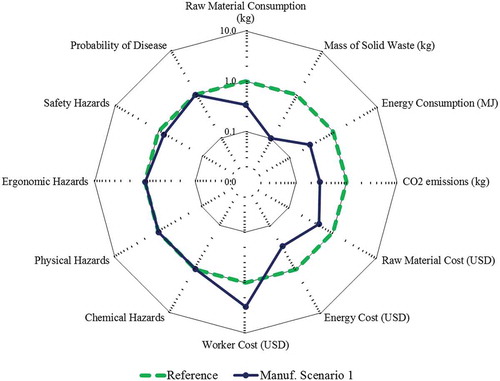
Figure 9. Radial chart comparison between reference product and manufacturing scenario 2 (logarithmic scale).
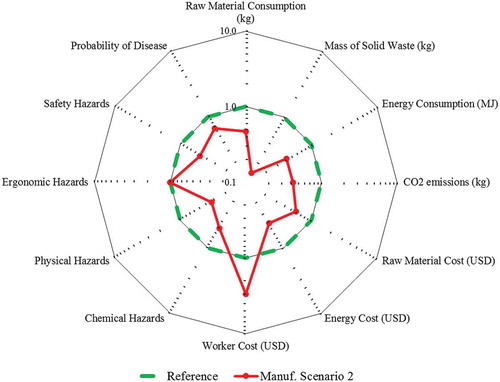
Table 10. Sustainability impact index measurement.
Figure 10. Inputs and outputs analysis for use stage.
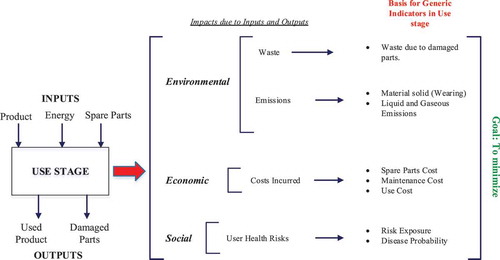
Table 11. RAISE form part 1.
Table 12. RAISE form part 2.