Figures & data
Figure 1. Schematic diagram of the experimental set up. (Adapted and modified from Yoro et al. Citation2017).
Table 1. Diffusional mass transfer parameters for the adsorption of CO2 on polyaspartamide at specific operating conditions compared with a recent study.
Table 2. Captured CO2 at different adsorption times.
Table 3. Models explored and assumptions made.
Figure 2. Boyd’s film diffusion model for CO2 adsorption on polyaspartamide at different pressure.
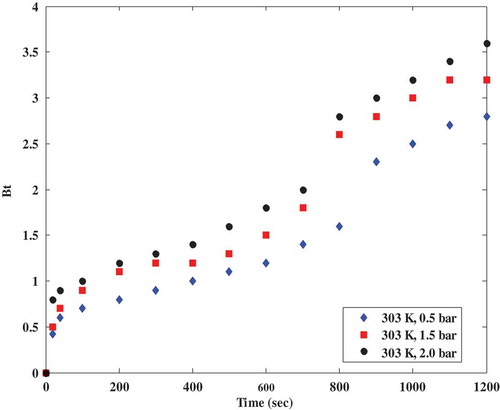
Figure 3. Boyd’s film diffusion model for CO2 adsorption onto polyaspartamide at different adsorption temperature and constant pressure.
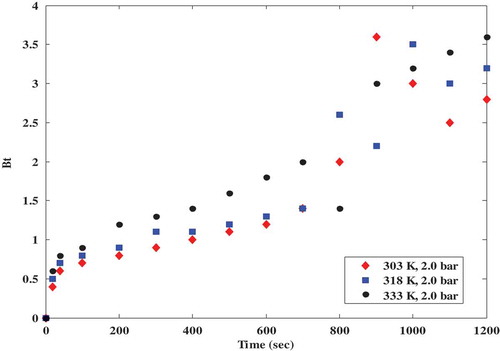
Figure 4. Interparticle diffusion model plots for CO2 adsorption on polyaspartamide at different adsorption temperature and constant pressure.
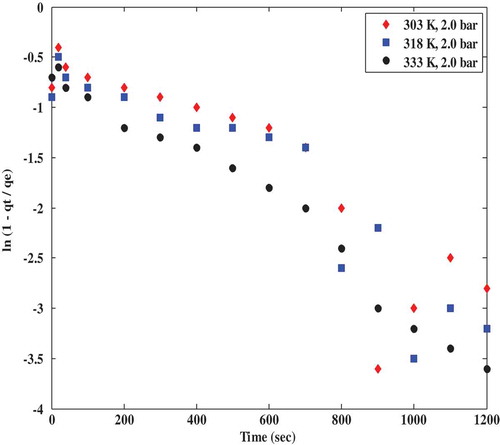
Figure 5. Interparticle diffusion model plots for CO2 adsorption on polyaspartamide at different CO2 partial pressures.
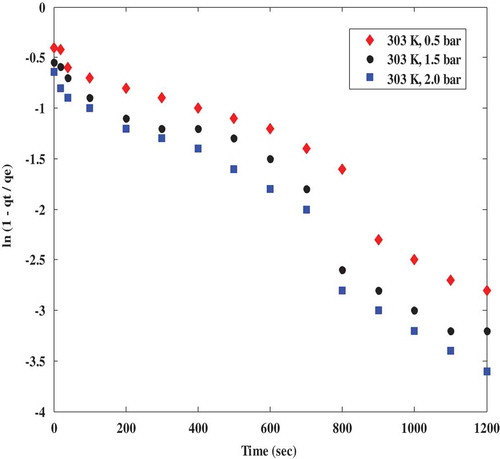
Figure 6. Intraparticle diffusion model plots for CO2 adsorption on polyaspartamide at different adsorption temperatures showing multilinearity.
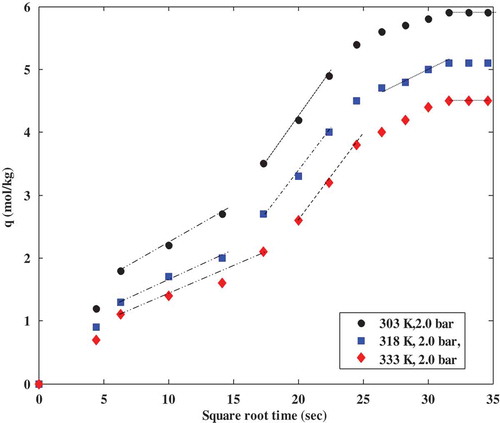
Figure 7. Intraparticle diffusion model plots for CO2 adsorption on polyaspartamide at different CO2 partial pressures showing multi-linearity.
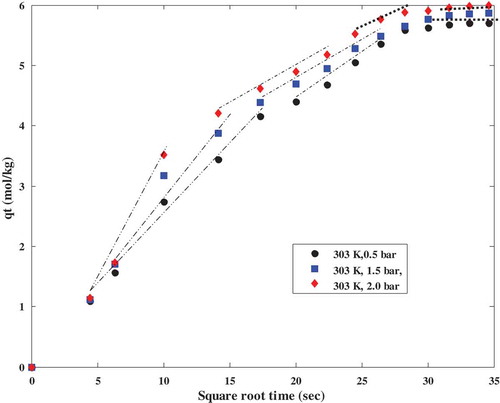
Figure 8. Breakthrough curves showing the effect of feed flow rate during the adsorption of CO2 on PAA: (Experimental conditions: feed pressure, 2 bar, and temperature 303 K).
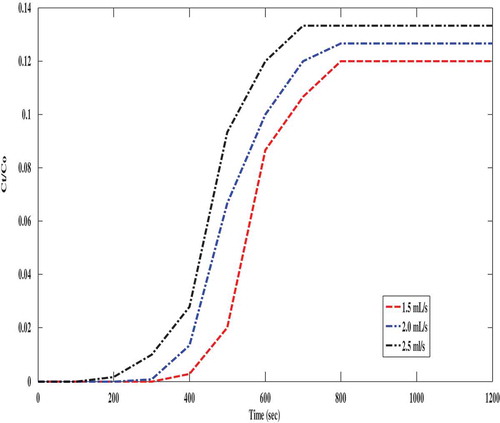
Table 4. Estimated breakthrough and bed contact times with maximum adsorption capacity of polyaspartamide at different gas flow rates.
Table 5. Adsorption efficiencies of polyaspartamide at different gas flow rates.
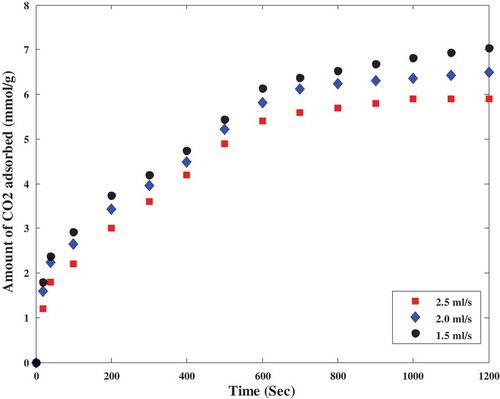
Figure 9. Effect of feed flow rates on the amount of CO2 adsorbed by polyaspartamide.