
Figures & data
Figure 1. Framework of sustainable supplier selection.
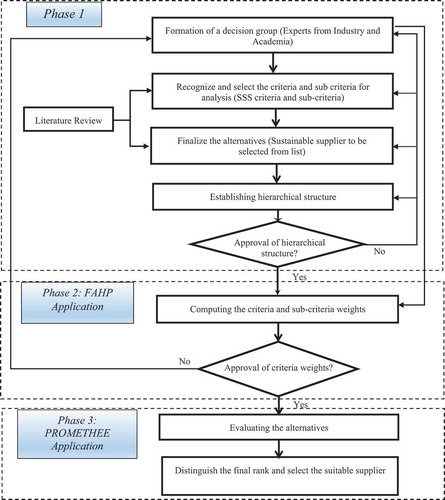
Table 1. Linguistic terms and corresponding fuzzy scales (Kabir and Hasin Citation2012; Şen and Çinar Citation2010).
Table 2. RI for different sizes of matrix (Mani, Agarwal, and Sharma Citation2014).
Figure 2. The intersection between and
.
Table 3. Types of generalized criteria of preference function (Modified from Gervásio and Da Silva Citation2012).
Figure 3. Decision hierarchy model (Source: Amindoust et al. Citation2012; Dobos and Vörösmarty Citation2014; Gold and Awasthi Citation2015; Hashemi, Karimi, and Tavana Citation2015; Mani, Agarwal, and Sharma Citation2014; Rao et al. Citation2017a, 2017c; Zimmer, Fröhling, and Schultmann 2016.
Table 4. Symbols and qualitative scales.
Table 5. Alternative suppliers’ performance with respect to criteria.
Table 6. Pairwise comparison matrix and weights with respect to major criteria.
Table 7. Weight distribution of all Sub-criteria.
Figure A1. Stainable supplier selection using Visual PROMETHEE. a,PROMETHEE I partial ranking. b) PROMETHEE II complete ranking.
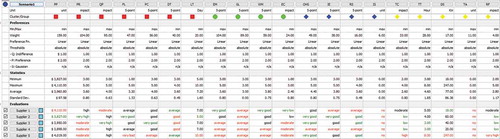
Table 8. The PROMITHEE II complete ranking.
Figure A2. PROMETHEE ranking.
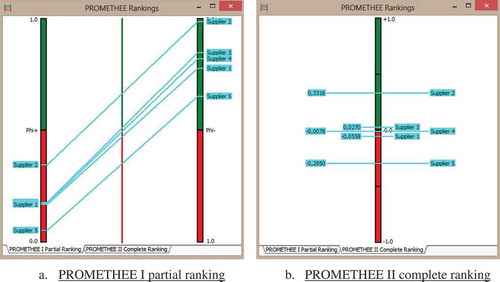
Figure A3. PROMETHEE network of supplier selection.
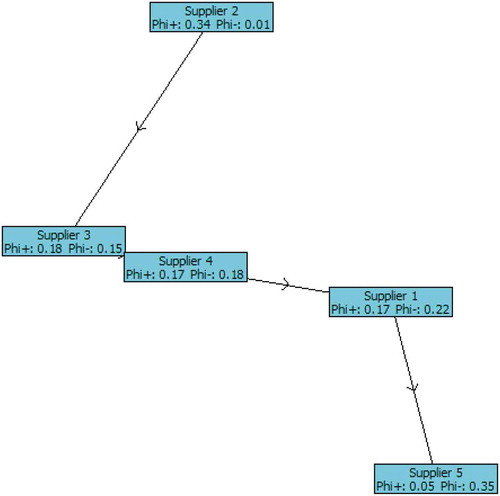
Figure 4. GAIA plane of supplier selection.
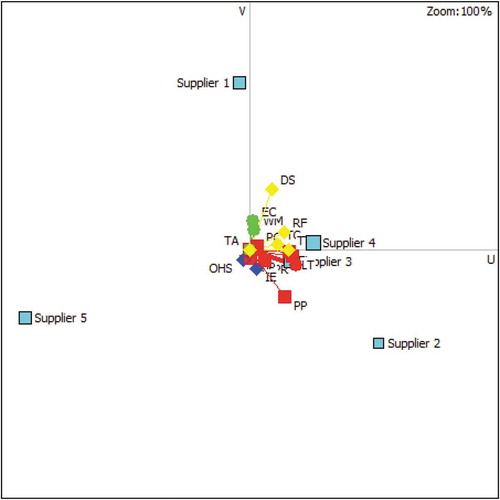
Figure 5. Sensitivity analysis using walking weight.
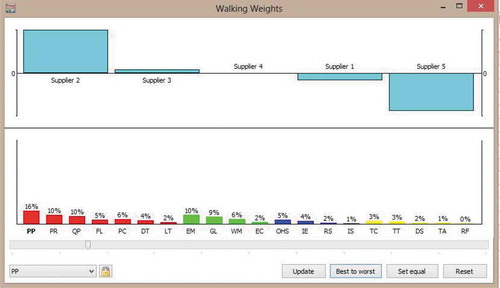
Table A1. Pairwise comparison matrix according to major criteria (defuzzified).
Table A2. Fuzzy synthetic extent values (Si) with respect to major criteria.
Table A3. Integral values (Ii) with respect to major criteria.