
Figures & data
Figure 1. Modularization role in mass customization and personalization. Adapted from (Koren et al. Citation2015).
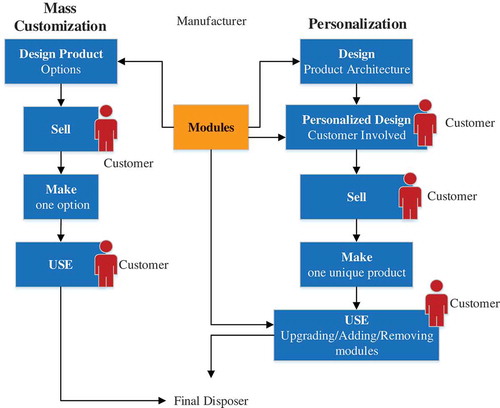
Table 1. Key differences between, mass customization and mass personalization. Adapted from (Koren et al. Citation2015), (Hu et al. Citation2011) .
Table 2. Sustainability impacts of personalization.
Table 3. Functional ranging MAPs (Mesa et al. Citation2015).
Table 4. Functional variety MAPs (Mesa et al. Citation2015).
Table 5. Examples of MAP implementation in products.
Figure 2. Lifecycle comparison between modular and open architecture products. ) and ) correspond to stages for modular product and stages for open architecture product respectively.
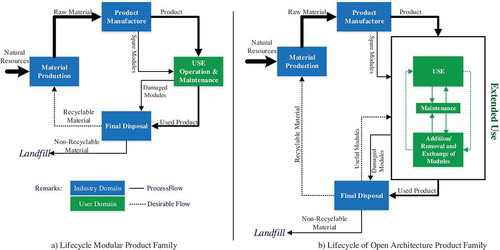
Figure 3. Lifecycle advantages of MAPs in modular and open architecture products.
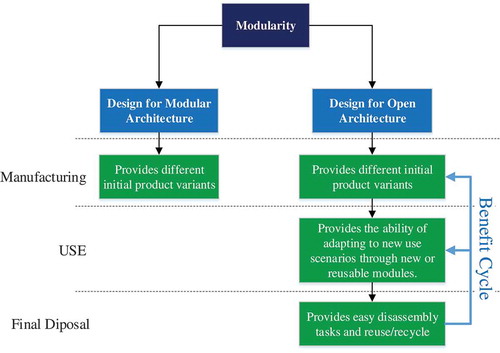
Table 6. Sustainability benefits, impacts, and limitations of MAPs.
Table 7. MAPs respect reusability, modular independence, and family product replacement.
Figure 4. Implementation of strategies and involved actors.
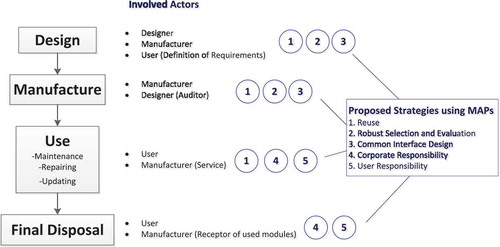
Table 8. Evaluation of proposed strategies for sustainability based on MAPs.
Table 9. Some existing approaches to enable the comprehension of the strategies for sustainability.