Figures & data
Table 1. Properties of pilot fuels and biomass.
Table 2. HHV prediction using the correlations.
Table 3. Lignocellulosic properties of biomass.
Figure 1. Experimental setup.
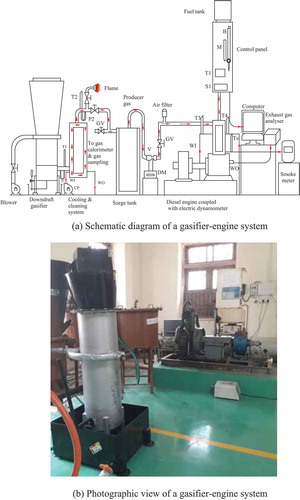
Table 4. Specifications of CI engine and downdraft gasifier.
Figure 2. Effect of biomass feedstock type on the BTE.
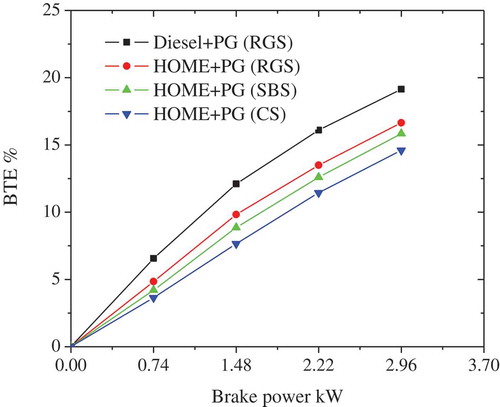
Figure 3. Effect of biomass feedstock type on the EGT.
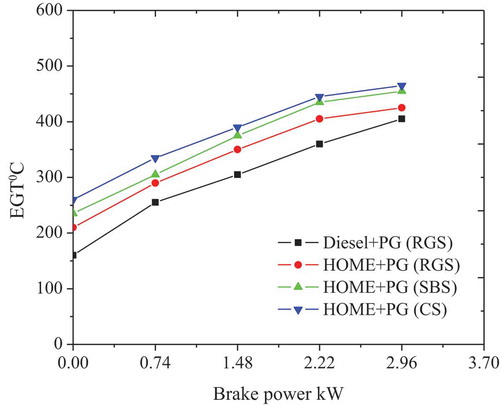
Figure 4. Effect of biomass feedstock type on the volumetric efficiency.
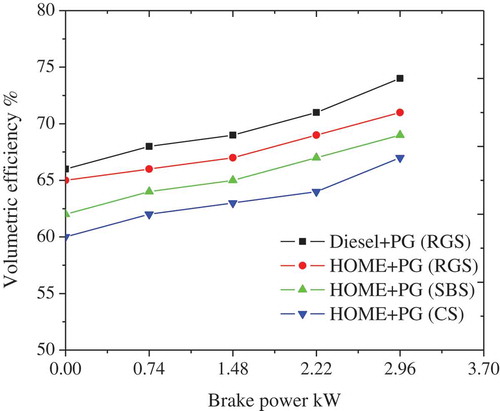
Figure 5. Effect of biomass feedstock type on the smoke opacity.
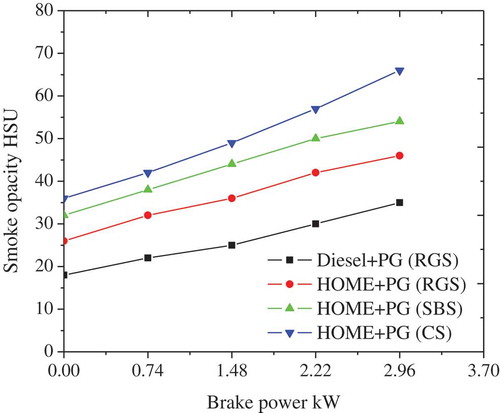
Figure 6. Effect of biomass feedstock type on the HC emission.
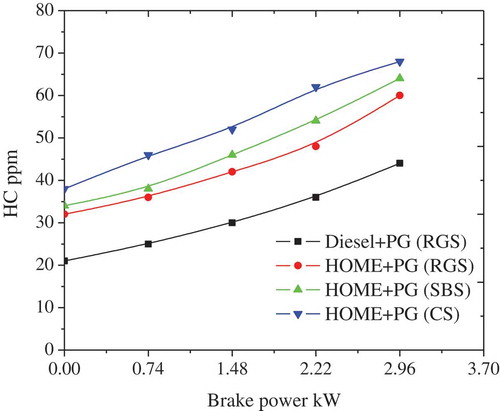
Figure 7. Effect of biomass feedstock type on the CO emission.
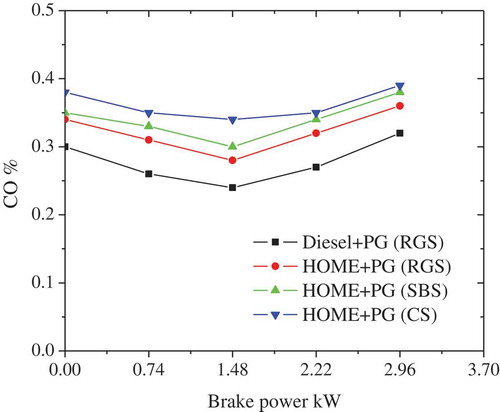
Figure 8. Effect of biomass feedstock type on the NOx emission.
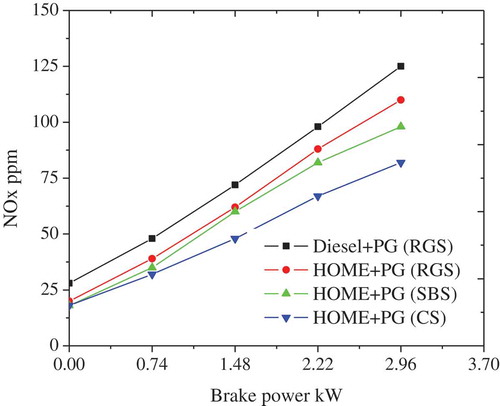
Figure 9. Effect of biomass feedstock type on the fuel substitution.
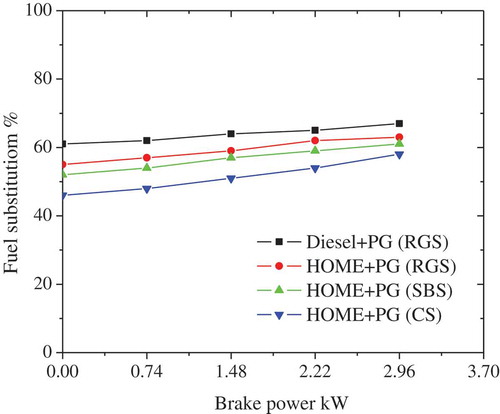
Figure 10. Effect of biomass feedstock type on the ignition delay.
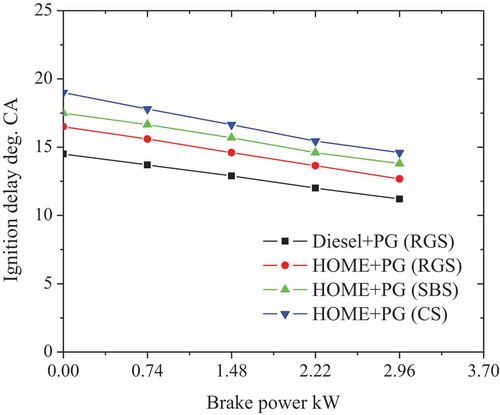
Figure 11. Effect of biomass feedstock type on the combustion duration.
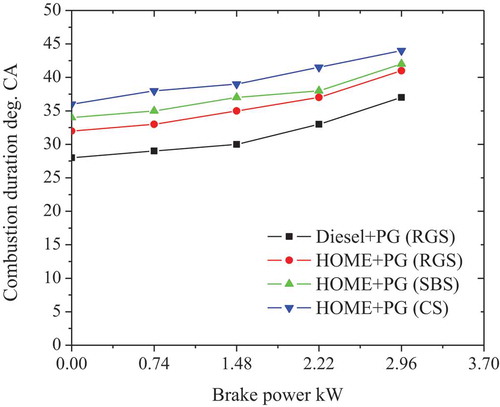
Figure 12. Cylinder pressure versus CA for different fuel combinations.
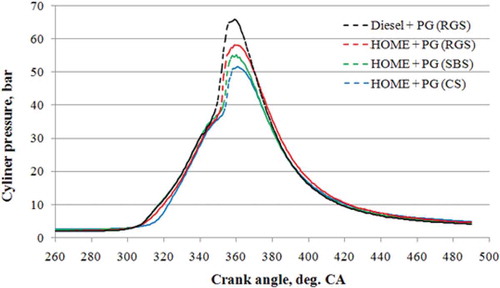
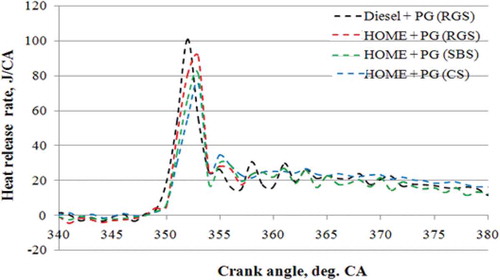
Figure 13. Heat release rate versus CA for different fuel combinations.