
Figures & data
Figure 1. Schematic diagram of present experiment set-up.
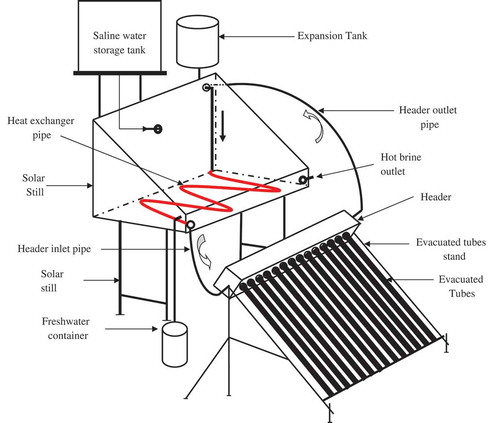
Figure 2. Photograph of experiment set-up.
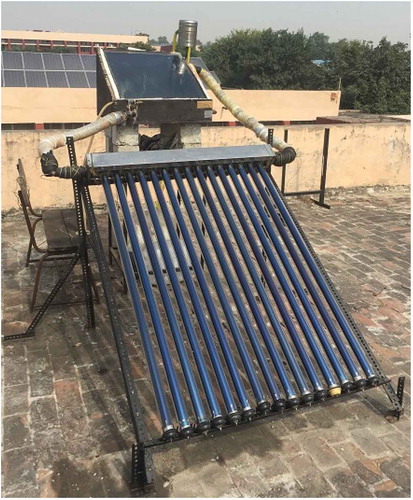
Table 1. Various specifications of experiment set-up.
Figure 3. Solar intensity and ambient temperature variation on different testing days.
Figure 4. Basin water temperature variation of both stills at different water depths.
Figure 5. Glass cover temperature variation of both stills at different water depths.
Figure 6. Hourly productivity variation of both stills at different water depths.
Figure 7. Accumulative productivity variation of both stills at distinct water depths.
Figure 8. Hourly efficiency variation of both stills at distinct water depths.
Figure 9. Daily overall efficiencies of both stills at all water depths.
Figure 10. Oil inlet and outlet temperature variations in heat exchanger with time for modified still on different testing days.
Figure 11. Variation of heat exchanger effectiveness with time for modified still.
Table 2. The costs of distinct items used in fabrication of the modified still.
Table 3. The costs of distinct items used in fabrication of the conventional still.
Table 4. Different parameter values obtained in the cost analysis of conventional still and modified still.