Figures & data
Table 1. Range of variables in ANN
Figure 1. Architecture of ANN model
Figure 2. pH effect on all studied coagulants for the removal of a) COD, b) TSS, c) Colour, d) TN and e) Turbidity (dose 1 g/L, 150 rpm rapid stirring rate)
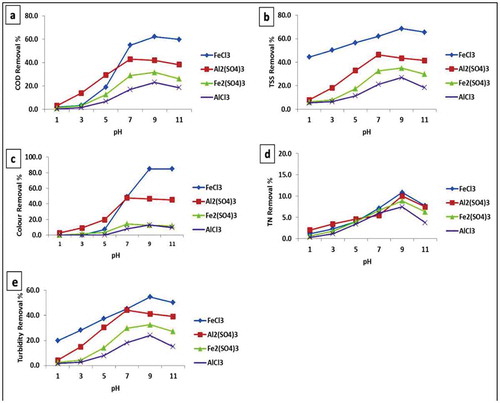
Figure 3. Operating conditions of Fecl3 for the removal of COD, TSS, Colour, TN and turbidity a) effect of dose, b) effect of rapid mixing speed, c) effect of rapid mixing time, d) effect of slow mixing speed, e) effect of slow mixing time and f) effect of settling time
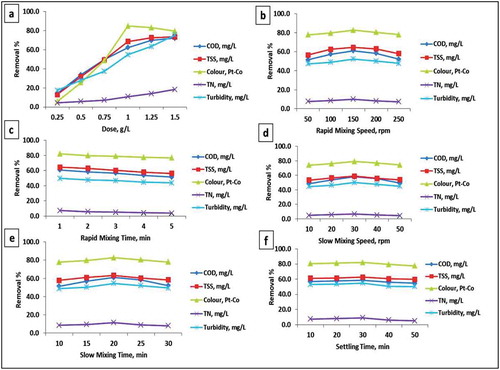
Figure 4. Raw and final effluent treated sample with optimum operating conditions by using 1 g/L FeCl3 at pH 9
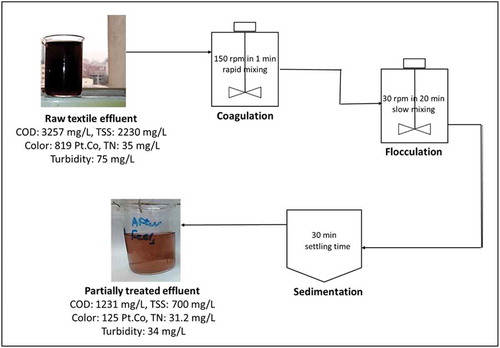
Table 2. Optimum operating conditions for the treatment of real textile effluents using different coagulants in various literatures
Figure 5. Predicted vs. target values for the removal of COD, TSS, colour, TN and turbidity based on the effect of: A1- dose, A2- rapid mixing speed, A3- slow mixing speed
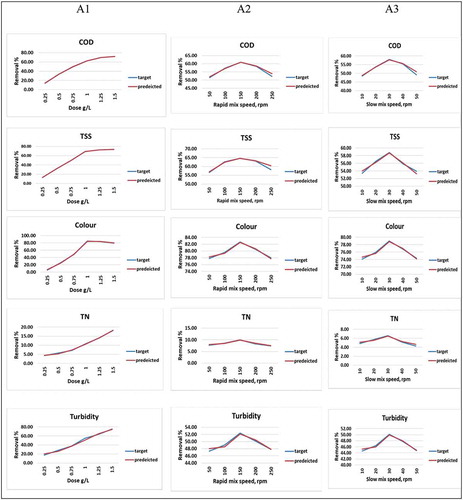
Figure 6. Predicted vs. target values for the removal of COD, TSS, colour, TN and turbidity based on the effect of: A4- rapid mixing time, A5- slow mixing time, A6- settling time
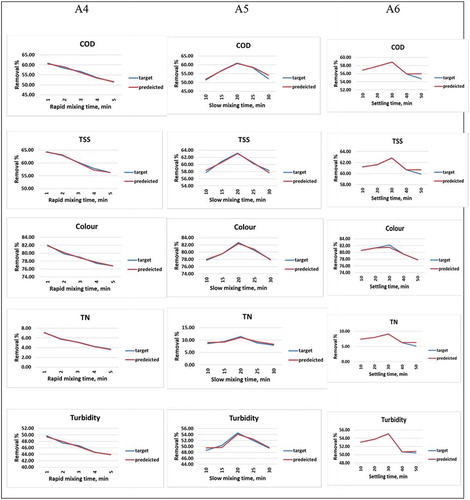
Figure 7. Predicted vs. target (actual) values for the removal of COD, TSS, colour, TN and turbidity based on the effect of all variables (Model B)
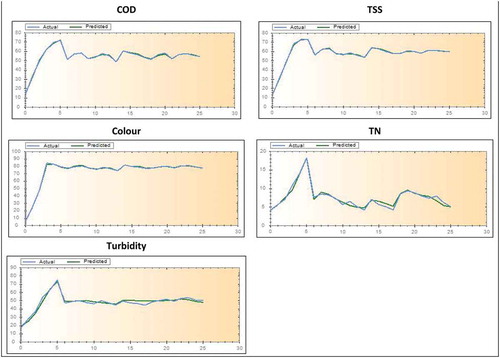
Figure 8. Linear regression between predicted (network output) & target for the removal of COD, TSS, colour, TN and turbidity based on the effect of: A1- dose, A2- rapid mixing speed, A3- slow mixing speed (Model A)
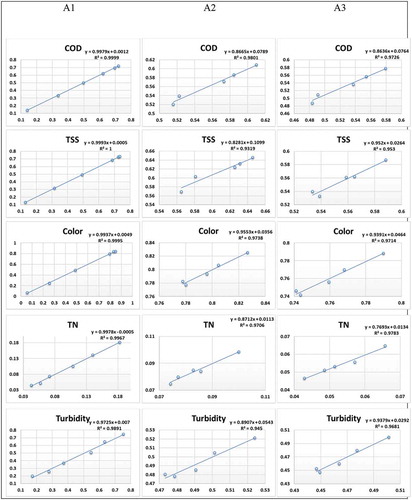
Figure 9. Linear regression between predicted (network output) & target for the removal of COD, TSS, colour, TN and turbidity based on the effect of: A4- rapid mixing time, A5- slow mixing time, A6- settling time (Model A)
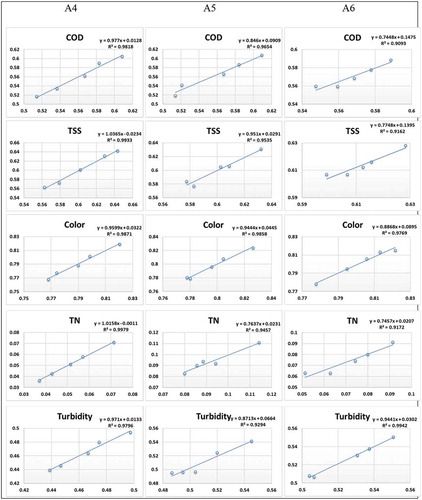
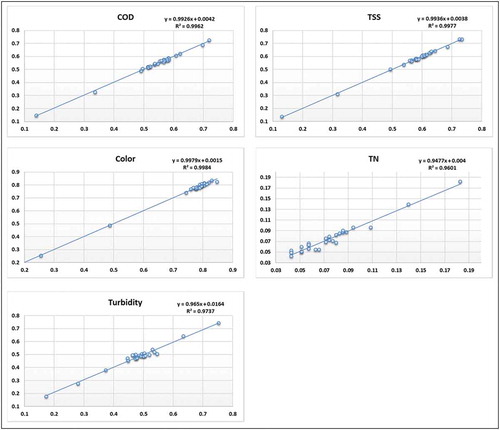
Figure 10. Linear regression between predicted (network output) & target for the removal of COD, TSS, colour, TN and turbidity based on the effect of all variables (Model B)