Figures & data
Figure 1. Average percentage contribution of agriculture, solid minerals and petroleum resources to real GDP (Jack, Nkwocha, and Odubo Citation2016)
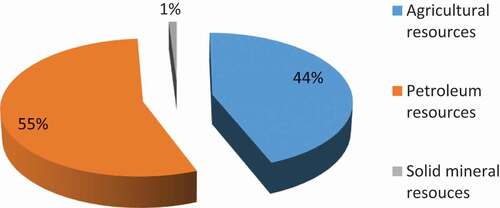
Figure 2. The oil and gas resources (Ighalo and Adeniyi Citation2020a)
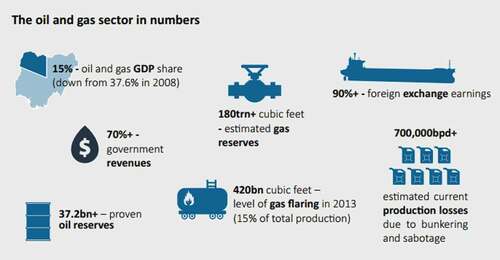
Figure 3. Main agricultural products in Nigeria (Imaenyin Citation2015)
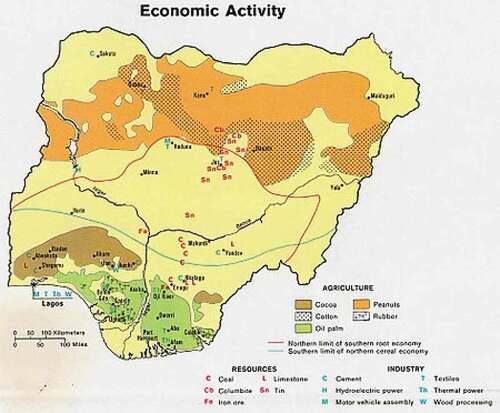
Figure 4. Distribution of solid minerals in Nigeria (Obaje Citation2009)
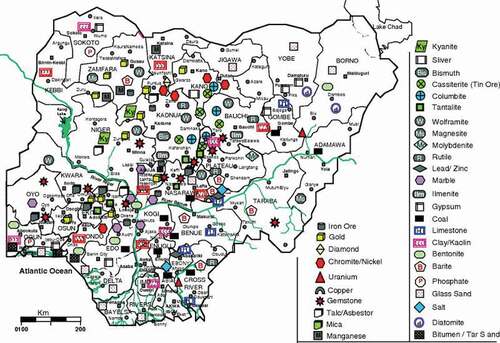
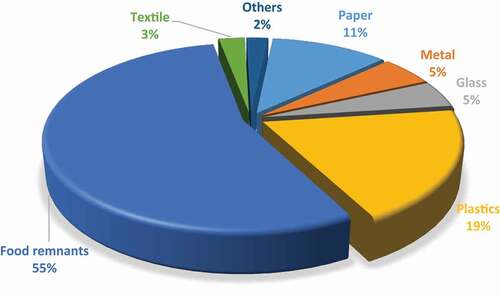
Figure 5. Typical composition of the solid waste stream in Nigeria (Duru, Ikpeama, and Ibekwe Citation2019)