Figures & data
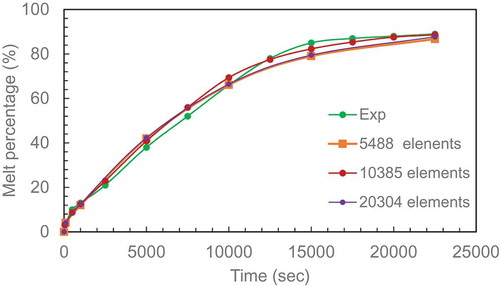
Figure 1 (a) Computational domain of the rectangular enclosure. (b) Grid independence study. Experimental data from .Hamad et al. (Citation2017). (c) Time step independence study. Experimental data from .Hamad et al. (Citation2017)
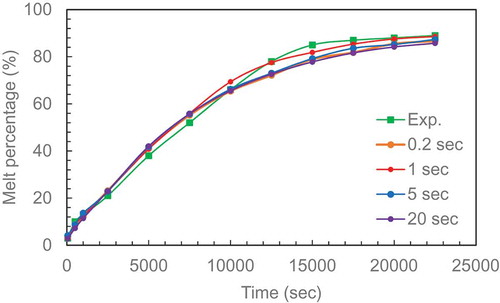
Figure 2 (a) Melting contour and velocity contour at 500 and 22,500 se. The graph for heat transfer is added to this Figure to complete the picture of the interaction between the three variables. (b) Evolution of the natural circulation velocity distribution with time at three lines plotted at 10 mm from the bottom (LL), 10 mm from the top (UL) and mid-height (ML) of the PCM rectangular enclosure (constant height case,155 x 67, AR = 2.31). (c) Variation of maximum velocity with time at three lines plotted. (d) Variation of temperature difference and maximum velocity with time for melted PCM in enclose (AR = 2.31)
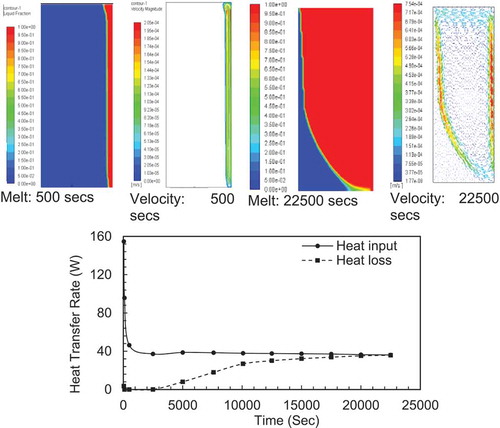
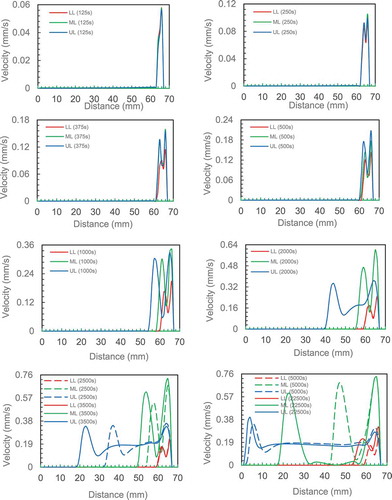
Figure 2 Continued
Figure 2 Continued
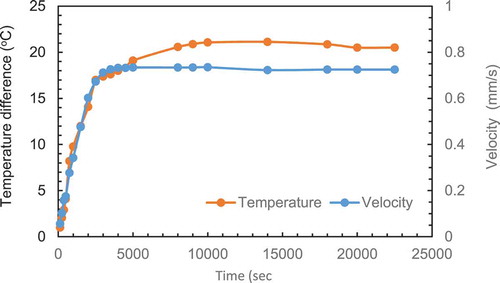
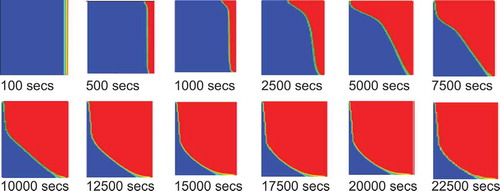
Figure 3 (a) The melt fraction contours for CFD set up for AR of 2.31. (b) The melt fraction contours of the experimental set up for AR of 2.31. (c) Overlay of CFD (dotted lines) and experimental (blocked lines) results. (d) Comparison of present data with previous work
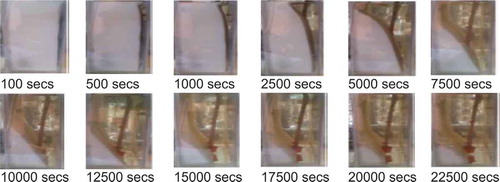
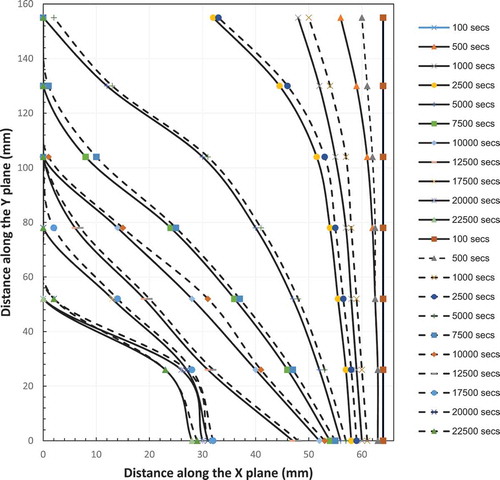
Figure 3 Continued
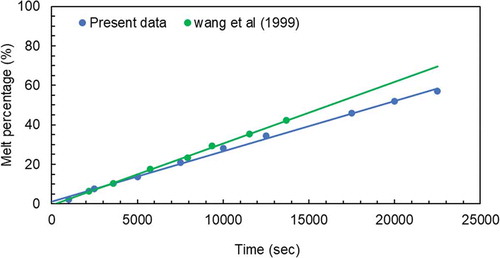
Figure 4 (a) The contours of melting fraction at constant height. (b) The contours of melting fraction for the case of constant volume
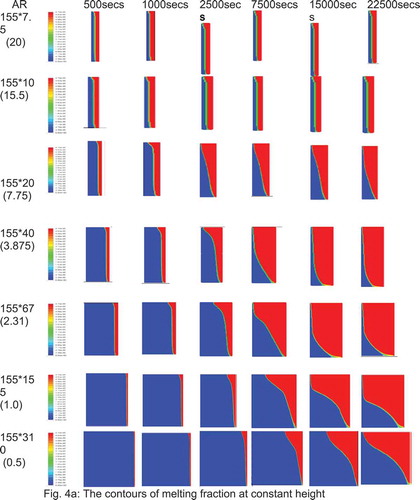
Figure 4 Continued
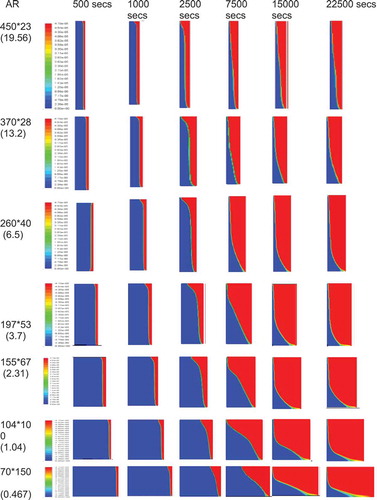
Figure 5 (a) The evolution of melt fraction with time for constant height case. (b) The evolution of melt fraction with time for constant volume case
Figure 6 (a) Evolution of heat transfer from hot water to PCM (heat input) and heat loss from PCM to cold water (heat loss) with time (constant height cases). (b) Evolution of heat transfer from hot water to PCM (heat input) and heat loss from PCM to cold water (heat loss) with time (constant volume cases)
Figure 6 Continued
Figure 7 Continued
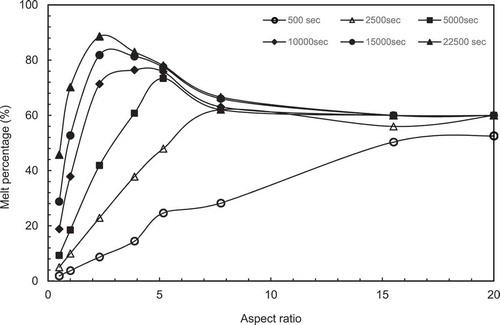
Figure 7 (a) Variation of melt percentage with aspect ratio (constant height case). (b) Variation of melt percentage with aspect ratio (constant volume case). (c) Variation of melt percentage with aspect ratio for both CH and CV cases. (d) Variation of heating surface area/PCM volume with aspect ratio for both constant height case (CH) and constant volume case (CV)
Figure 7 Continued
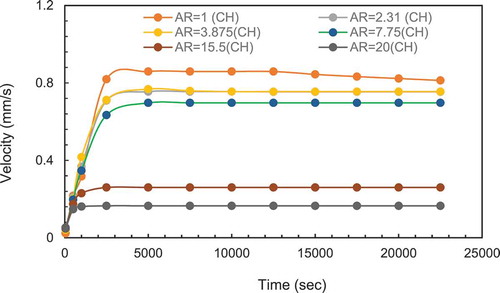
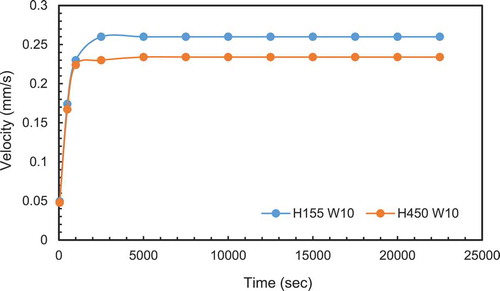
Figure 8 (a) Variation of maximum velocity with time for different aspect ratios (Constant height case). (b) Variation of maximum velocity with time for different aspect. Ratios (Constant volume case). (c) Variation of maximum circulation velocity time for 10 mm thickness and 2 different heights
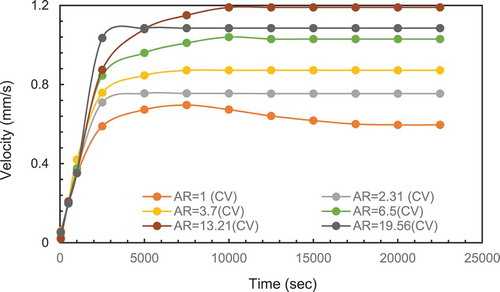
Figure 8 Continued