
Figures & data
Figure 1. Methodological steps
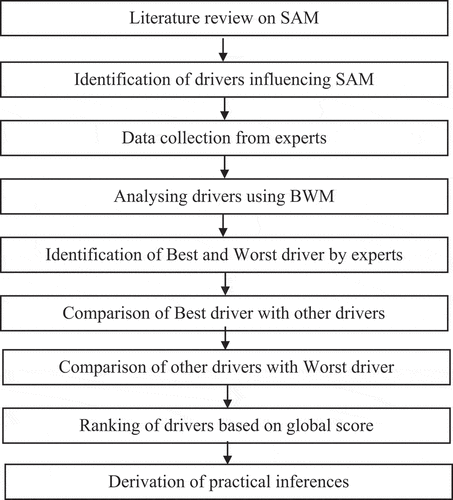
Table 1. Previous studies on BWM application in Sustainability domain
Table 2. Consistency index (CI)
Table 3. Drivers of sustainable additive manufacturing
Table 4. Best and worst driver specified by expert 1–4 for material category
Table 5. Comparison of Best driver with other drivers (BO) by expert 1–4 for material category
Table 6. Comparison of other driver with worst drivers (OW) by expert 1–4 for material category
Table 7. Weights of driver along with consistency for material category
Table 8(b). Weights of drivers along with consistency for material category
Table 8(c). Weights of drivers along with consistency for management and stake holders category
Table 8(d). Weights of drivers along with consistency for customer/ supplier/ competitor category
Table 8(e). Weights of drivers along with consistency for collaboration and trends category
Table 8(f). Weights of drivers along with consistency for technology category
Table 8(g). Weights of drivers along with consistency for standards and regulations category
Table 8(h). Weights of drivers along with consistency for design category
Table 8(i). Weights of drivers along with consistency for process category
Table 8(a). Weights of Categories along with consistency
Table 9. Prioritised ranking of drivers of Sustainable Additive Manufacturing
Table 10. Benchmarking key results with previous studies
Figure 2. Drivers ranking by varying weights of criteria
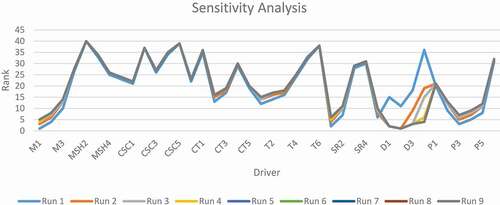
Table A1 (a). Best and worst category specified by expert 1–4
Table A1 (b). Comparison of best category with other categories (BO) by expert 1–4
Table A1 (c). Comparison of other categories with worst category (OW) by expert 1–4
Table A2 (a). Best and worst driver specified by expert 1–4 for material category
Table A2 (b). Comparison of best driver with other drivers (BO) by expert 1–4 for material category
Table A2 (c). Comparison of other drivers with worst driver (OW) by expert 1–4 for material category
Table A3 (a). Best and worst driver specified by expert 1–4 for Management and stake holders category
Table A3 (b). Comparison of best driver with other drivers (BO) by expert 1–4 for management and stake holders category
Table A3 (c). Comparison of other drivers with worst driver (OW) by expert 1–4 for management and stake holders category
Table A4 (a). Best and worst driver specified by expert 1–4 for customer/ supplier/ competitor category
Table A4 (b). Comparison of best driver with other drivers (BO) by expert 1–4 for customer/ supplier/ competitor category
Table A4 (c). Comparison of other drivers with worst driver (OW) by expert 1–4 for customer/ supplier/ competitor category
Table A5 (a). Best and worst driver specified by expert 1–4 for collaboration and trends category
Table A5 (b). Comparison of best driver with other drivers (BO) by expert 1–4 for collaboration and trends category
Table A5 (c). Comparison of other drivers with worst driver (OW) by expert 1–4 for collaboration and trends category
Table A6 (a). Best and worst driver specified by expert 1–4 for technology category
Table A6 (b). Comparison of best driver with other drivers (BO) by expert 1–4 for technology category
Table A6 (c). Comparison of other drivers with worst driver (OW) by expert 1–4 for technology category
Table A7 (a). Best and worst driver specified by expert 1–4 for standards and regulations category
Table A7 (b). Comparison of best driver with other drivers (BO) by expert 1–4 for standards and regulations category
Table A7 (c). Comparison of other drivers with worst driver (OW) by expert 1–4 for standards and regulations category
Table A8 (a). Best and worst driver specified by expert 1–4 for design category
Table A8 (b). Comparison of best driver with other drivers (BO) by expert 1–4 for design category
Table A8 (c). Comparison of other drivers with worst driver (OW) by expert 1–4 for design category
Table A9 (a). Best and worst driver specified by expert 1–4 for process category
Table A9 (b). Comparison of bbest driver with other drivers (BO) by expert 1–4 for process category
Table A9 (c). Comparison of other drivers with worst driver (OW) by expert 1–4 for process category
Table A10. Weights of driver criteria for sensitivity analysis
Table A11. Ranking of drivers for sensitivity analysis for different weights